Glossary
Abridged life table
Any life table where the ages, or times since the start event, are grouped rather than showing single years. Abridged life tables are therefore shorter in length than single year tables and often more convenient. If there is uncertainty about precise age, or considerable age heaping, then abridged tables are often more realistic then trying to deal with single years of age. Five-year age groups are common although it is normal to show the first year of life separately, because of the preference for quoting infant mortality. NB: Age groupings in an abridged table do not need to be evenly spaced.
Abstinence
Abstinence refers to non-engagement in sexual intercourse, whether voluntary or involuntary. A period of abstinence may last days, weeks, months or years, and may or may not reoccur. Abstinence acts to lower fertility, on both an individual and a population level. Common forms of abstinence include periodic abstinence, premarital abstinence and postpartum abstinence.
ACASI
Method of data capture. Abbreviation of audio computer assisted self interview.
Ageing
Ageing may refer to two different processes. Firstly it may refer to the ageing of an individual. This is the process by which a person changes through time, physically, psychologically and socially. Individual ageing is measured chronologically, and is usually given by age at last birthday.
Ageing may also refer to population ageing.
Age-sex structure
The age and sex structure of a population is simply the composition of the population in terms of age and sex. This may be expressed as absolute numbers or percentages. The age-sex structure is often represented graphically as a population pyramid.
Age-specific fertility rate
An age-specific fertility rate is the number of live births occurring to a particular age group of women per year. It is often expressed per 1000 women. Age groups used are often a single year, or five year groups.
Age structural transition
The age structural transition is the process by which a population shifts from a young age structure to an old age structure following the decline in fertility during the demographic transition. The use of the term ‘age structural transition’ to refer to these changes has been promoted by the IUSSP Committee on Age-Structural Transitions and Policy (see for example, Pool 2005).
Annuity rates
Annuity rates are proportions of an initial lump sum of money that are guaranteed to be paid out every year for the depositor’s remaining lifetime. Although this is a purely commercial arrangement the calculation of such rates relies heavily on life tables, which are able to estimate remaining life expectancy from any age.
Anonymous
Data that are anonymous cannot be traced back to the respondent. Each questionnaire is allocated an unique identifier or code that replace respondents names, addresses etc.
Balancing equation
The balancing equation is a fundamental axiom of demography. It states that a future population size will be the existing size minus any deaths that have occurred, plus births that have occurred, with further corrections for in- and out-migration. A corollary of this is that the growth rate of a population will be the crude birth rate minus the crude death rate, with a correction for a net migration rate. The balancing equation may therefore seem obvious but serves as a reminder that populations can only change in size by a limited number of processes.
Birth-interval analysis
Birth intervals in demography are usually taken as the interval between one birth and the next - not between a birth and the next pregnancy which is common in some other disciplines. A live birth interval would be between one live birth and the next live birth – ignoring intervening abortions and stillbirths. This interval is an important factor in the wellbeing of the births and the mother and is therefore closely studied. The interval can be split into components – infecundability period, waiting time to conceive, abstinence period, pregnancy and others. Determining birth intervals by studying or modelling these components is known as birth interval analysis.
Birth history
A specific part of a demographic survey instrument (questionnaire), addressed to mothers, where births are listed in date order along with supplementary information such as dates of death, vaccination status, breastfeeding, etc. Usually presented in the questionnaire as a grid. Invaluable for demographic fertility and/or mortality analysis. May be a full birth history, where all births are listed in order, or a short birth history, where only a restricted number of births (e.g. the most recent three), or only births in a particular period (e.g. the last 5 years) are recorded. Demographic and Health Surveys typically collect full birth histories which have allowed unprecedented information on international fertility and mortality to be assessed.
CAPI
Method of data capture. Abbreviation of computer assisted personal interview.
CASI
Method of data capture. Abbreviation of computer assisted self interview.
CATI
Method of data capture. Abbreviation of computer assisted telephone interview.
Cause-specific mortality fractions
When investigating causes of death, the proportions of all deaths investigated that can be ascribed a specific cause, based on categorizations previously agreed as useful.
CAWI
Method of data capture. Abbreviation of computer assisted web interview.
Censoring
A common phenomenon in all studies involving duration data and terminating events - requiring processing before the analysis can proceed. Survival analysis requires that a terminal event is specified. If this terminal event does not occur – either because the study closes or because another event intervenes – the duration of time already recorded cannot be discarded without biasing the study. The timeline is therefore closed by declaring a censoring event and this allows the time duration to be included in the analysis but not the terminating event. These cases are known as censored cases.
An example would be a study of time from cancer diagnosis to death, running for five years. Many subjects might survive the full five years – so there is no terminating event and they are "censored" at five years. The duration "counts" but the terminating event does not. Others may die within the five years, but not of cancer. Contact with others may be lost. It might be decided to censor these cases. What constitutes censoring in any particular study will have to be the subject of discussion before analysis starts. The life table can cope with censoring.
Census
A form of population enumeration, in which every individual within a defined population (usually a country) is counted at the same time. Details regarding age, sex, marital status, occupation etc are often collected at the same time. Censuses provide the most accurate information on population structure, and provide a basis for the denominator of most rates that demographers calculate.
Century month code
A way of coding dates such that the duration between two dates can easily be found by difference of the codes. A method commonly used by DHS is counting months from January 1900, so June 1988 would be 12 × 88 + 6 = CMC 1062. This methodology is still in use but has largely been superseded by statistical or spreadsheet software which can recognise dates and calculate durations between them automatically. This provides durations to the nearest day, rather than the nearest month as provided by CMCs.
Chiang's formula
A relatively simple formula for the conversion of a true (central) death rate into a mortality risk (an nmx rate into a nqx risk). The latter is required to start a life table but data often presents as the former so a conversion is required. The full formula (see LT1 session, Section 5, page 5) requires a measure of the proportion of the interval lived by those who die (nax). This can often be imputed as 0.5 and if so the formula simplifies considerably. Chiang’s formula is the recommended method for these conversions but other methods are available. The formula is not always named after Chiang and may present as an anonymous demographic formula, especially in its simplified form.
Child-woman ratio
The child-woman ratio gives a measure of the number of children aged 0-4 in relation to the number of women aged 15-49 (or occasionally 15-44). As it is based entirely on population numbers, it provides a rough indicator of fertility when no data on numbers of births are available. A disadvantage is that it is also affected by infant and child mortality. As it only includes the number of children who are still living, if infant and child mortality is high, fertility may be underestimated.
Closed population
A closed population is one which is closed to in- and out-migration. The only way a closed population may change in size or age-sex structure is through changes in fertility and mortality. In reality, the only population which is truly closed is the world population, however demographers often use the concept of a closed population during demographic modelling. This is partly to show the effects of other population processes more clearly, and partly because of the complexity of measuring and modelling migration.
Cohort
A cohort is a group of people who experienced the same demographic event during a particular period of time. This will most commonly refer to births during a set period of time, but may also refer to marriages, onset of puberty, migration, first birth etc.
Cohort life table
A life table that follows a true cohort of people through from birth to death (also known as a generation life table). This can take a long time to complete and true cohort tables for all ages are quite rare. Cohort tables for short periods – say the first 5 years of life – are however quite easy to construct. Cohort tables are usually based on a year of birth, or period of birth, e.g. born between 1920 and 1925. More recent cohort tables are possible but the cohorts may not have finished their transit through life. In this case future risks of dying are sometimes projected to finish the cohort. These tables can be useful for estimating future life expectancy, but are somewhat speculative.
Completed family size
The preferred name for total cohort fertility rate, i.e. the TFR for a real cohort of women assessed at the end of their fertility. As a cohort measure it is not subject to tempo fluctuations as the period TFR is, and is an objective measure of actual fertility for the cohort concerned. More stable than the period TFR but having disadvantages of being an historical rather than current measure. Shares the same metric as the period TFR, i.e. the mean number of births per woman across the full reproductive span, but relates to a real cohort rather than a synthetic one.
Confidence interval
A confidence interval is a range of values calculated around an estimate which is defined so that the true population value has a given probability of falling within.
Confidentiality
This concerns who has the right of access to data provided by survey respondents. Researchers have an obligation towards respondents and should ensure that identities and respondent’s data are kept confidential. Researchers are responsible to put in place mechanisms that protect a respondents confidentiality.
Contraceptive prevalence
Contraceptive prevalence is the percentage of women currently using, or whose sexual partner is currently using, any method of contraception. It is usually reported for married or in-union women aged 15 to 49.
Crude birth rate
The crude birth rate (CBR) is the number of live births in a year divided by the mid-year population, and multiplied by 1000. There are a number of problems with the crude birth rate. Firstly it is not a true rate, as not everyone in the denominator is truly at risk of giving birth. Secondly, as with other crude rates, it may be affected by the age structure of the population. As such it should not be used for comparisons between countries.
Crude death rate
The crude death rate (CDR) is the number of deaths in a year divided by the mid-year population and multiplied by 1000. It is the best known general measure of mortality within a population. However, as it is a crude rate there are problems with its use. The crude death rate is strongly affected by age structure (as risk of death is strongly determined by age), and so it should not be used for cross-country comparisons.
Current status life table
A life table that can be formed from simple data in the form of yes/no responses about whether the outcome has occurred by a certain age or date. With sensitive subjects such as age at first sex, or outcomes where date reporting is likely to be poor, such as duration of breastfeeding, dates may be reported but can be of poor quality. The decision may then be made not to use the reported dates but merely to record whether the outcome has, or has not, occurred by the age at interview or date of interview. A life table can be formed from this data although it is usually not as accurate as using reliably reported dates or ages.
Demand satisfied
The percent of women (or their partners) who desire either to have no further children or to postpone the next child who are currently using a modern contraceptive method.
Demographic and Health Survey
Demographic and Health Surveys (DHS) are nationally-representative, cross-national household surveys carried out in low income countries. They provide information on a wide range of topics related to demography and health, including infant, child and maternal mortality, fertility rates and preferences, prevalence of stunting, immunisation status, HIV prevalence etc. As all DHS use standardised measurement tools, it is possible to make valid cross-country comparisons for the regions in which surveys have been carried out.
Demographic dividend
The demographic dividend is the low dependency ratio that develops for several decades during the course of the demographic transition. It describes populations that have experienced several decades of fertility decline and contain a large proportion of young adults relative to children or elderly people as a result of the early stages of population ageing. This is described as a dividend as it can promote an increase in the investment rate and rapid economic growth.
Demographic transition
The demographic transition is the process by which populations move from high mortality and fertility rates, to low mortality and fertility rates as a country develops from a pre-industrial to an industrialized economic system. This is typically demonstrated through a demographic transition model. As fertility decline often lags behind mortality decline, there is an intermediate phase in the middle of the transition characterised by high growth rates.
Dependency ratio
Dependency ratios give the number of economically inactive people in relation to each economically active person. Classification of economically active and inactive are usually made on the basis of age, with everyone aged less than 16 and everyone aged 65 and over considered economically inactive. The overall dependency ratio can be broken down into constituent parts, giving the child dependency ratio (number of children in relation to each economically active person) and the old-age dependency ratio (number of people aged 65 and over in relation to each economically active person).
Double entry
Double data entry is a process in which the same data are independently entered into two separate copies of the database. The two databases are then compared and any discrepancies checked against the original questionnaires.
Doubling time
The doubling time of a population is the number of years required for a specified population to double in size, if current rates of population growth were to continue. This is calculated using the following equation:
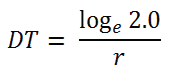
Where r is the growth rate of the population. This can approximated by dividing 70 by the growth rate.
Enumerator error
These are errors in data that result from an enumerators or fieldworkers wrongly transcribing data onto questionnaires or keying in data onto electronic devices.
Emigration
Emigration is the movement of people from a national population of interest to a different country on a long-term basis that results in a change in their country of usual residence.
Equal probability selection methods
Equal probability selection (EPS) methods are sampling methods that ensure each sampling unit has the same chance of being selected, such as simple random sampling.
European Fertility Project
The influential European Fertility Project started in 1963 and was led by the American Demographer Ansley Coale. Based in Princeton, the project analysed province-based European data from 1890 to 1960. It aimed:
- To create a quantitative record of the European fertility transition
- To identify the social and economic determinants of the modern fertility decline in Europe so as to elucidate the causal mechanisms of the fertility transition.
The project resulted in the publication of nine major books summarizing the change in childbearing over a century in the 700 provinces in Europe.
Family planning effort score
First developed by Lapham and Mauldin in 1972, this indicator is a score measuring the strength of the national family planning (FP) programme of a given country on four dimensions (policies, services, evaluation, and method access). The score has a potential range of 0-300 points, based on 1-10 points for each of 30 items.
Fecundability
Fecundability is the probability of becoming pregnant during any one menstrual cycle, given that the woman is not contracepting and is exposed to usual levels of intercourse. It is expressed as a probability and an accepted average throughout the reproductive ages is taken as 0.2. This means that conception would on average take 5 months to occur, even with regular intercourse. However this figure is known to vary considerably from woman to woman and by age – being higher for younger women and declining from about age 35. Fecundability can be increased to some extent by more regular intercourse, intercourse focused on times related to ovulation, and by treatment of existing STDs.
Fecundity
The potential for a woman to bear a child. To be distinguished from fertility which, in Demography, is only determined by actual live births. Fecundity is therefore a hypothetical concept, whereas fertility is provable. A woman is considered fecund while in childbearing ages unless there are physical reasons why she could not become pregnant e.g. had undergone a tubal ligation. She may however become infecund for short periods – for instance after childbirth. Fecundity is a concept important to the proximate determinants of fertility (see Session 5).
Gender equity
Gender equity is the fairness of treatment of men and women according to their respective needs.
General fertility rate
The general fertility rate is the number of live births in a year divided by the mid-year population of women aged 15-59 (or 44), multiplied by 1000. It provides a better measure of fertility than the crude birth rate as it only includes those who are at risk of a birth (i.e. women of reproductive age). However it still does not account for varying levels of fertility within the wide age bracket of 15-49.
Generation life table
See cohort life table ![]() .
.
Global burden of disease
The Global Burden of Disease Study (GBD) is an ambitious international project attempting to quantify both mortality and disability from major diseases into a single measure that represents the relative burden of each disease. The aim of this was to compare the effects of diseases, nationally and globally, in a standardised way, based entirely on objective epidemiological and demographic methods, not influenced by advocate groups. The standardised measure used is the disability adjusted life year (DALY) which represents the healthy years of life lost, due either to premature mortality or to years lived with a disability. The GBD therefore prioritises diseases objectively.
Growth rate
A population’s growth rate is the ratio of growth in a given period to the mean population during that period. Growth is the balance of births, deaths, in-migration, and out-migration during the period concerned as stated by the balancing equation. The growth rate is usually calculated on an annual basis.
Hazard
An instantaneous (mortality) rate at a certain age, and in demography usually measured on an annualized basis. Sometimes also referred to as a failure rate or the force of mortality.
Immigration
Immigration is the movement of people into a national population of interest from a different country on a long-term basis that results in a change in their country of usual residence.
Independent and dependent variables
An independent variable causes, determines or influences the dependent variable. The distinction between independent and dependent variables is important when investigating cause-effect relationships. Figure 1 shows the direct relationship between independent and dependent variables.
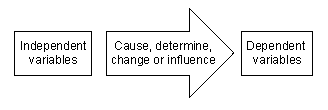
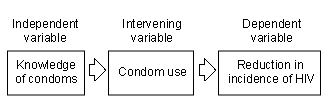
It is not uncommon for the relationship between independent and dependent to be indirect, where the independent variable acts on the dependent variable through intervening variables. These intervening variables either decrease or increase the effect the independent variable has on the dependent variable.
Figure 2 shows the indirect relationship, through an intervening variable, of independent and dependent variables
InDepth
InDepth is a research organisation based in several low and middle-income countries, including several sites in sub-Saharan Africa. It is associated with a number of longitudinal studies and demographic surveillance sites. InDepth builds capacity and standardises research methods across these studies and provides practical research support for the sites. Because of the varied amount of data to which it has access InDepth has attempted to provide model mortality patterns for sub-Saharan Africa.
Induced abortion
Induced abortion refers to the deliberate termination of a pregnancy before the foetus is capable of sustaining an independent extra-uterine life.
Infanticide
Infanticide refers to the wilful killing of an infant, usually shortly after birth. Infanticide may be used as a tool of family limitation, with unwanted infants being killed. In most areas infanticide as a method of family limitation has been replaced by induced abortion. Infanticide may also be used to conceal a birth, especially in situations where there is a strong stigma to childbearing outside of marriage.
Infant mortality rate
The infant mortality rate (IMR) is the number of deaths to those aged under 1 year divided by the total live births in a year, multiplied by 1000. Infant mortality rates are considered a key indicator of health conditions and development, especially in low income countries where rates are still high.
In-migration
In-migration is the movement of people into a population of interest from elsewhere on a long-term basis that involves a change in their place of usual residence. It refers to both migratory moves that originated in another country (immigration) and changes of residence that are internal to a country.
Insurance motive
This refers to hypothesised desire of couples in high-mortality populations to have "additional" children as a result out of an anticipation that some of their children will not survive to adulthood.
International Classification of Diseases
A hierarchical classification of all diseases and external causes that is used globally in an attempt to ensure consistent reporting of morbidities and causes of death. It is maintained and promoted by WHO and undergoes periodic revision. The current version is revision 10 (ICD-10) although a number of countries may still be using earlier versions.
Item non-response
Item non-response occurs when a participant does not answer a specific question asked.
Item response rate
This is the number of respondents who respond to a particular question compared to the number asked the question, and is usually expressed as a percentage.
Lactational amenorrhea
Amenorrhea is the absence of menstruation. Lactational amenorrhea refers to the period following birth when a woman, if fully breastfeeding, will be unable to conceive. This occurs because lactation suppresses ovulation.
Lexis diagram
A useful type of graph that helps to identify the constituents of cohorts. Typically having a y-axis of age and an x-axis of calendar period – both drawn to the same scale – cohorts can be shown as blocks moving at a 45° angle. Seemingly simple and obvious it is surprisingly helpful in identifying cohorts for mortality or fertility analysis.
Life expectancy
Life expectancy is the length of time expected before failure, from any stated time after an initiating event. For mortality it is the length of life expected, from any exact age, before death.
"Expectation of life" without qualification is taken to mean from birth. Life expectancy is given by the "e" column of a life table, with e0 denoting from birth. Life expectancy from any exact age, or time, from the start of the table can be read from the column.
In a mortality table, life expectancy is calculated as the total person-years remaining in the stationary population, divided by the number of survivors at the exact age specified.
Life line
Life lines are a way of depicting the lives of individuals on a Lexis diagram. A life line for an individual will begin on their precise date of birth, and progress diagonally across the Lexis diagram as the individual ages through time.
Life table
Life tables are one of the most widely used methods of analysis in demography. Calculated from age-specific mortality rates, life tables show the probability of dying (and surviving) between certain ages. From this it is possible to calculate summary measures of mortality, such as life expectancy.
Although first used for mortality analysis, the technique can be applied to any data which comes in the form of varying durations of time between a definable start point and end point, e.g. time until divorce, time until contraceptive discontinuation etc. Used in this way, life tables are a form of survival analysis .
Lifetime migrant
A person who is living in a different place from where they were born is known as a lifetime migrant.
Loss to follow up
When studying a group of people over a period of time, it is inevitable that some will remove themselves from the study population i.e. by moving away etc. These people are known as lost to follow up. This may present a problem if the likelihood of being lost to follow up is related to the outcome or exposure of interest.
m-type rates
m-type rates are rates based on a numerator of events and a denominator of person-years of people at risk of experiencing the event. If person-years cannot be assessed then a suitable denominator would need to be a mean population size, often known as "mid-year population".
As such m-type rates are more commonly known as "central rates" in epidemiology and are considered "true rates", as opposed to risks where the denominator is the number starting the interval. True (m-type) rates are typically denoted by m or M. m-type rates need conversion to risks before a life table can be constructed.
Mean age at childbearing
The mean age at childbearing (MAC) is the arithmetic mean age of mothers at the birth of their children. It is computed as the sum of the age-specific fertility rates, nFx weighted by age at the midpoint of the age intervals. The MAC can be computed for a real birth cohort of women or a synthetic cohort (i.e., period):

Median age
The age that divides a population into two numerically equal groups; that is, half the people are younger than this age and half are older. It is a single index that summarizes the age distribution of a population. In 2010, median ages ranged from 15.5 in Niger to 44.7 in Japan.
Metadata
Metadata means "data about data". It refers to the language used to describe, catalogue, and search for survey data, and should provide a detailed description of the survey and its variables.
Millennium Development Goals
The Millennium Development Goals (MDGs) are eight international development goals which have been agreed by all 193 United Nations member states and various international organisations. The goals are to:
- eradicate extreme poverty and hunger
- achieve universal primary education
- promote gender equality and empower women
- reduce child mortality
- improve maternal health
- combat HIV/AIDS, malaria and other diseases
- ensure environmental sustainability
- develop a global partnership for development.
The aim is to achieve all eight goals by 2015. For more information visit the UN Development Programme website ![]()
Modern contraceptive methods
Modern contraceptive methods are those with higher efficacy than traditional methods (rhythm, withdrawal, breastfeeding), and include: female and male sterilisation, oral contraceptives, intrauterine contraceptive device, injectables, implants, female and male condoms, diaphragm, contraceptive foam and jelly, lactational amenorrhoea method (although this is considered a traditional method in UNPD estimates and projections), standard days method, 2-day method, emergency contraception, cervical cap, and contraceptive sponge.
Morbidity
Morbidity refers to the level of disease and disability in a population. Levels of morbidity may be inferred from cause of death statistics, data from hospitals and GP surgeries, population registers, or through data obtained through special health surveys.
Mortality crisis
A mortality crisis is defined as a sudden, pronounced rise in the death rate. The amount by which the death rate has to rise to be considered a mortality crisis varies by author.
Out-migration
Out-migration is the movement of people from a population of interest to somewhere else on a long-term basis that involves a change in their place of usual residence. It refers to both migratory moves to another country (emigration) and changes of residence that are internal to a country.
Natural increase
Natural increase is the difference between the births and deaths occurring in a population. It differs from the population growth rate in that the latter also reflects net migration. The rate of natural increase is the crude birth rate minus the crude death rate.
Negative momentum
See population momentum.
Net migration
Net migration is the difference between the inward and outward flows of migrants to and from a population, i.e. in-migrants minus out-migrants.
Net reproduction rate
The net reproduction rate is the number of daughters born to a hypothetical cohort of women who experience the current age-specific fertility rates throughout their reproductive lives taking into account the mortality of those women.
Oldest old
"Oldest old" refers to the proportion of the population aged 85 and over. Studies of the oldest old are of growing importance in many high income countries, as the proportion of the population within the oldest old category is rapidly growing and may present specific problems for health and care services, as people aged over 85 are more likely to be frail and have multiple chronic health conditions than the general population.
Open population
An open population is a population which experiences migration. This is in contrast to a closed population.
PAPI
Method of data capture. Abbreviation of pencil and paper interview.
Parity
The total number of live births a woman has ever had. Women who have never had a live birth may be referred to as nulliparous. Women who have had one live birth are primiparous, and those with more than one live birth are multiparous.
Peer interviewers
Interviewers recruited from the same peer group as respondents. They should come from the same socio-economic background, be the same sex, speak the same language, live in the same neighbourhood, and be a similar age etc.
Period life table
A life table that is constructed from data specific to a particular period, such as a specific year or 5 year period. The rates that form a 1985 period life table would use only 1985 data - infant mortality would be data on 0-1 year olds living in 1985 – and rates for 80 year olds would be from 80 year olds living in 1985. The result is a cross-sectional pattern of mortality which is correct for 1985 but is not based on a true cohort – it is a synthetic cohort. Period life tables are the most common form of life tables and are very widely used as the data to form them is more easily available. They have an advantage of being able to show a very recent pattern of mortality, without requiring a cohort to be completed. Compare to a cohort table or a generation table, which are based on real cohorts.
Person-time at risk
Person-time at risk refers to the total amount of time spent by individuals in a population at risk of having an outcome of interest occur to them. To be "at risk" of the event, a person must be alive, within the specific population of interest, and not already have the outcome, e.g. a pregnant woman is no longer "at risk" of becoming pregnant.
The total time at risk for each individual is summed, and this figure may provide the denominator for calculating rates.Person-years at risk
See Person-time at risk .
Periodic abstinence
Periodic abstinence is the avoidance of sexual intercourse during the fertile phases of a woman’s menstrual cycle in order to avoid pregnancy. It is estimated that worldwide, 2.6% of couples within the reproductive span use periodic abstinence as a form of birth control. This may be done through monitoring of cervical mucus or basal body temperature which changes in regular patterns throughout the menstrual cycle. The timing of periodic abstinence may also be calculated through the "calendar" or "rhythm" method, which calculates the day of ovulation on the basis of the length of previous menstrual cycles.
Person years
A statistical technique typically used to provide accurate denominators for rates. Rather than using approximations (such as mid-year population) person years are the sum of all segments of life lived by anybody present at any time in the period under consideration.
To calculate this individual-level data is required, with dates of entry into and exit from the considered time period. These time segments are accumulated, usually by computerised routines, to form the appropriate denominator for a set of events in the numerator. Because of computerisation person-years is a common approach nowadays, if accurately dated data is available. As such it has replaced more approximate measures based on mean population size.
Population ageing
Population ageing refers to the increase in the proportion of a population at older ages (usually those aged over 60 or 65). This is reflected in an increasing median age and a shift in dependency ratios. Population ageing is primarily caused by the decline in fertility which reduces the number of children in a population (increasing the relative importance of the older age groups). In populations where fertility has been low for a long period, increases in survival at the oldest ages may contribute to population ageing as those in the oldest age groups remain in the population for a longer period of time. This process has many socioeconomic and health consequences, including an increasing burden of health and social care costs and the need to implement sustainable options for economic support of the elderly.
Population density
Population density is calculated as the total population divided by the total area which that population resides in. It provides a simple measure of the pressure of population on space and resources. Problems may arise when population density is calculated for countries with large areas which are uninhabitable, as it may give an impression of "emptiness" when actually the population is crowded in small areas within the total territory.
Population dynamics
Population dynamics is the study of the changes in population size and structure brought about by mortality, fertility and migration.
Population flows
Population flows are the demographic events of mortality, fertility and migration which bring about changes in the size and structure of a population.
Population momentum
Population momentum refers to the inbuilt potential for growth (or decline) inherent in a population’s age-sex structure. It is the amount a population would increase (or decrease) in size, if the fertility of the population changed immediately to replacement level.
Population projection
The prediction of a future population from knowledge of the current population and of fertility rates and mortality rates. Adjustment for net migration is usually made at a later stage. Occasionally prediction of a past population is required and this is possible with the same procedures used in reverse – known as backward projection.
Projection is usually done in 5 or 10 year stages, with probabilities of dying across the 5 or 10 year period being supplied by a suitable life table. Assumptions of future mortality and fertility are usually required and models are often used in this process.
Population pyramids
Population pyramids are a way of depicting the age-sex structure of a population. They consist of two horizontal histograms, placed side by side, indicating either the number or the proportion of persons in each age group or single year of age. Convention states that men are shown on the left histogram, and women are shown on the right.
Population stock
Population stock is the size and composition of a population at a given moment in time. The population stock can be changed by population flows, and current population stock reflects past population flows.
Population studies
Population studies is the area of study which connects demographic processes with wider social, economic and political influences. As a result, population studies is an interdisciplinary field which overlaps with economics, history, anthropology, public policy and many others.
Positive checks
The concept of positive checks was first outlined by Thomas Malthus (1766–1834) in his famous treatise "An Essay on the Principle of Population" (1798). He theorised that population growth was limited by two mechanisms – positive checks and preventative checks. Positive checks actively reduce a growing population by increasing the death rate. They include famines, pestilence and warfare.
Postpartum abstinence
Postpartum abstinence is the avoidance of sexual intercourse for a period of time after a woman has given birth. This has the effect of delaying subsequent pregnancies and lowering total fertility. Although delaying of pregnancies is the outcome of postpartum abstinence, it is not necessarily the reason. There may be cultural customs, taboos and health beliefs relating to sexual intercourse after childbirth that are the reasons for the period of abstinence.
Potential
Glossary content pending.
Precision
Precision is a measure of how accurate an estimate calculated from a sample is when compared to the true population value. The greater the sampling error, the less precise the estimate. This is reflected in a larger standard error.
Precision is the ability of a study to measure the magnitude of a difference or effect with minimal sampling error.
Premarital abstinence
Common in a number of societies (especially historically), premarital abstinence is the avoidance of sexual intercourse before marriage. It has the effect of largely confining reproduction to marital unions and is often related to gender, with women abstaining more than men.
Preventative checks
The concept of preventative checks was first outlined by Thomas Malthus (1766–1834) in his famous treatise "An Essay on the Principle of Population" (1798). He theorised that population growth was limited by two mechanisms – positive checks and preventative checks. Preventative checks reduce the growth rate by reducing the number of births occurring. Malthus believed that the only way this could occur was through an increase in age at first marriage (and strict celibacy outside of marriage).
Primary sampling units
The units sampled at the first stage in multi-stage or cluster sampling.
Proximate determinants of fertility
A phrase adopted to describe a small set of behavioural and biological factors which are known to explain the widely differing levels of fertility among human populations. They occupy a place between sociological motivations for controlling fertility and the actual physiological mechanisms whereby those motivations are effected. As such they represent the intermediate mechanisms by which fertility intentions are translated into actual fertility reduction. Each determinant can be quantified to show its independent effect in exerting downward pressure on maximum potential fertility (total fecundity).
The four determinants originally identified were age at marriage, post-partum infecundability, and use of contraception and abortion. In a later revision by Stover age at marriage was revised to proportion of women sexually active and a fifth determinant of pathological sterility added.
Replacement level fertility
Replacement level fertility is the fertility level at which, given prevailing mortality rates, population growth is 0%. If every woman has two children, that is theoretically enough to replace her and her partner. However not all children reach reproductive age, and so women have to have more than two children on average to ensure the replacement of each generation. In low mortality setting 2.1 children per woman on average is often taken as replacement level fertility. In high mortality settings, replacement level fertility could be considerably higher (as more children will die before reaching reproductive age).
Radix
The radix (Latin: "root") of a life table is the number of people (or objects under consideration) present at the start of the survivorship column. It is a nominal number unrelated to the real number of people in the study but standardised to be a round number such as 100,000, or 1,000. In statistical packages the radix is often not shown but will typically be unity (1), which means the remainder of the column are proportions of people surviving. Whatever radix is selected the lx column of the life table will always represent survivors from that radix.
Risks
Risks are analogous to rates but are based on a numerator of events and a denominator of persons at risk of the event at the start of the considered interval. Risks are therefore probabilities rather than "true rates" and are bounded by zero and one – whereas rates can on occasions exceed one. In demography risks are sometimes known as "q-type" risks because they are typically denoted by q or Q. If data presents as true, central ("m-type") rates a conversion to q-type risks are necessary before the construction of a life table can commence.
Singulate mean age at marriage
The singulate mean age at marriage (SMAM) is a demographic measure constructed from proportions of women married by single year of age. As such it is an example of a current status life table ![]() form of calculation. It is the average number of years spent single before marriage occurs. This measure was devised by the demographer John Hajnal and much used in his research on nuptiality and country-specific ages at marriage and childbearing.
form of calculation. It is the average number of years spent single before marriage occurs. This measure was devised by the demographer John Hajnal and much used in his research on nuptiality and country-specific ages at marriage and childbearing.
Since age at marriage, age at first sex and age at first birth are no longer simply related in many parts of the world the use of the measure has declined. It also had a drawback of not being a very current measure – data on which it was based spanning many years. If such a measure is needed it is usually now provided by the median age at marriage, which is simpler to calculate.
Sampling frame
This is a list of units, (usually households, or individuals) from which the sample is selected. The existence of an up-to-date sampling frame often defines the study population.
Sex ratio
The sex ratio is the number of men for every woman (or for every 100 women). It may be calculated for the total population or for a specific age group. The sex ratio at birth is usually between 104 – 107 males for every 100 females, but decreases over the life span as males have higher mortality at every age.
Stable
See Stable population ![]() .
.
Stable population
A stable population is one which has an unchanging age structure. A stable population may still be growing (or shrinking), however each age group must be growing (or shrinking) by the same amount so as to remain the same size relative to each other. A stable population which is not growing nor shrinking is called a stationary population ![]() . Stable populations are always closed to migration.
. Stable populations are always closed to migration.
Stationary population
A stationary population is one which has an unchanging age structure and is neither growing nor shrinking, i.e. the growth rate is equal to zero. For the population to be neither growing nor shrinking, the number of deaths annually must equal the number of births. Stationary populations have never been observed in reality, however the concept underpins the formation of life tables.
Statistical power
Statistical power refers to the probability that a difference (or effect) will be detected by a study if it is truly there. The larger the sample size, the greater the statistical power of the study.
Sub-fecundity
Fecundity is defined as the monthly probability of conception in the absence of the use of contraception. Sub-fecundity, therefore, refers to diminished probabilities of conception under these circumstances.
Survey response rate
This is the number of respondents who complete a questionnaire compared to the number approached, and is usually expressed as a percentage. Example: if 1,300 respondents are asked to participate and 993 agree and successfully complete the questionnaire then the response rate would be 76%.
The response rate can also apply to individual questions, and may be referred to as item response rate.
Survival analysis
Survival analysis is a generic statistical term for the analysis of data which is presented in the form of durations of time between a specified initiating event e.g. birth, and a final closing event e.g. death. If such data comes from a survey or register there will always be the phenomenon of censoring to deal with.
Life tables are a demographic form of survival analysis, but other approaches exist. Survival analysis allows the comparison of risks of death or failure between groups.
Synthetic cohort
Also known as a hypothetical cohort it is a pseudo-cohort whereby period rates are applied to defined populations at successive age-groups and the survivors, or number of events produced, appear to come from a real cohort. The lx column of a period life table is a good example. It is headed by a radix and represents the survivors from that radix at specified ages. This appears to be a cohort but is in fact synthetic because it has been produced by successive application of period rates, by age, to the radix. Because period life tables are produced from probabilities of dying in a particular period of time the lx column is not based on the experiences of a real cohort but it is treated as though it were a cohort, hence the name "synthetic".
The construction of the total period fertility rate (TFR) is another example – age-specific fertility rates are applied to a standard population of a single woman in each age group and the resulting hypothetical births summed to give a measure of the number of births expected from the synthetic cohort of one woman moving through different age-groups. The difference between a real or synthetic cohort is well illustrated by a Lexis diagram
Tempo effects
Short-term fluctuations in total fertility rate (TFR) may give the impression that overall fertility has fallen or risen. However these fluctuations may be a result of couples postponing births. If these births are had in a later year, or at a later age, then the completed family size may remain the same. It is these artificial changes in TFR due to changes in timing of births that are referred to as tempo effects.
Total fertility rate
The number of children a woman would have if she experienced the age-specific fertility rates for the period in question throughout her reproductive life. Unless specified as a cohort rate (see completed family size) the total fertility rate (TFR) is by default considered a period measure. As such it is based on a synthetic cohort and relates to a specified calendar period. It is a directly standardised measure based on a standard population of one woman at each single year of age. It is free of population structure differences between populations which allows comparison of fertility between groups and internationally. Because of this flexibility, and simplicity and immediacy of calculation – capable of producing current estimates – it is the single most widely used and reported measure of fertility. It suffers however from fluctuations from year to year – tempo fluctuations. Calculated from age-specific fertility rates.
Total marital fertility rate
Analogous to the total fertility rate but considering married (or stable cohabiting) women only in the denominator – or the age-specific rates of married women. As such it is always a higher figure than the TFR. The number of children a woman would have if she experienced the married age-specific fertility rates for the period in question throughout her reproductive life.
Unit non-response
Unit non-response occurs when the unit of enumeration (in the census, this is typically the household) does not participate in the data collection exercise.
Unmet need
Unmet need for family planning is the percentage of women who are sexually active and do not want to become pregnant and yet are not using any form of contraception.
Urbanisation
Urbanisation is an increase in the proportion of a population that lives in urban areas. Urbanisation can result from rural-to-urban migration, from more rapid natural increase in the urban population than the rural population, or from the redesignation of previously rural areas as urban.
Vital registration
Vital registration is the registration of demographic events occurring in a population. Vital registration forms the basic source of information for calculating rates. Unfortunately a considerable proportion of the world’s population live in countries which have no, or unreliable, vital registration systems.
Vital statistics
Vital statistics are the data collected concerning demographic events, including births, deaths, marriages, divorces, adoptions etc.
Withdrawal
Also known as coitus interruptus, withdrawal is a method of birth control in which the male partner withdraws his penis from the female partner’s vagina before ejaculation.