The world today (cont.)
Future Population Growth
The graph below shows different population projections by the UN Population Division.
The projections (constant, high, medium and low) are each based on a different fertility scenario. Each of the projections uses the same mortality scenario, in which life expectancy is projected to gradually increase, with slower increases in countries with higher life expectancy. Projections for countries affected by the HIV epidemic also take into account the stage of the epidemic and its likely progression.
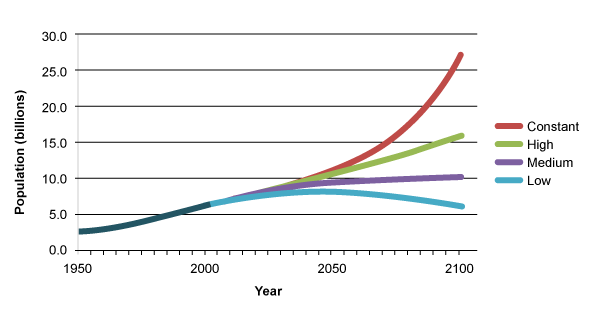
Projected population size, 2011-2100. Source: UN Population
Constant-fertility variant
For each country, fertility remains constant at the level estimated for the 2005-2010 period.
Medium-fertility variant
Assumes that fertility in each country will converge towards replacement level (an average of 2.1 children per woman). The rate at which this is assumed to happen is based on observed fertility trends for the period 1950-2010.
Low-fertility variant
Fertility is projected to remain 0.5 children below the fertility projected in the medium-fertility variant model.
High-fertility variant
Fertility is projected to remain 0.5 children above the fertility projected in the medium-fertility variant model.
From this graph it is easy to see the large impact on population size a small difference in fertility can have. Between the medium-fertility variant and the high-fertility variant there is a difference of just 0.5 children per woman on average, and yet this small variation results in a difference of 5.7 billion people by 2100.