Age-sex structures and population pyramids (cont.)
Population pyramids
Population pyramids show the age-sex structure of a population. They are also potentially very informative about the history of a population and its future prospects.
There are a few simple rules for the construction of population pyramids:
- Population pyramids consist of two histograms placed on their side and back to back.
- They can show absolute numbers or percentages, but the x-axis must be labelled accordingly. When comparing populations, percentages should be used.
- If percentages are used, these must be calculated for each age-sex group from the total population (males and females), not just the total population of a single sex.
- Age is depicted on the y-axis, with the youngest at the bottom, and must be labelled accordingly.
- Age scale can be in single years, or five year age groups depending on the precision needed.
- The age groups used must be of equal width, apart from the final open ended age group.
- Statistics for males are plotted on the left, and females on the right.
![]() Click to see an example of a population pyramid
Click to see an example of a population pyramid ![]() .
.
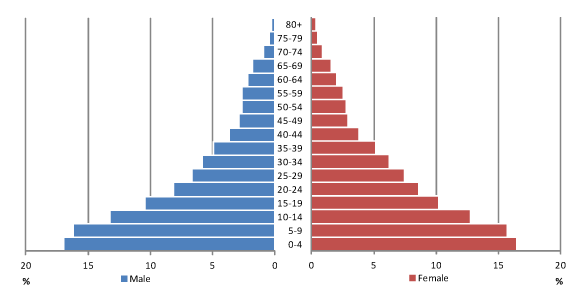
Population pyramid of Iran, 1990. Source: UN Population Division (2011)