Population history (cont.)
England and Wales, 1971
![]() The population pyramid for England and Wales in 1971 has a number of indentations which are related to historical events occurring over the past century. Click on the highlighted text below to display these.
The population pyramid for England and Wales in 1971 has a number of indentations which are related to historical events occurring over the past century. Click on the highlighted text below to display these.

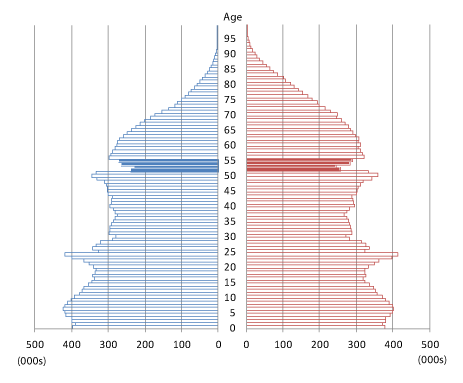

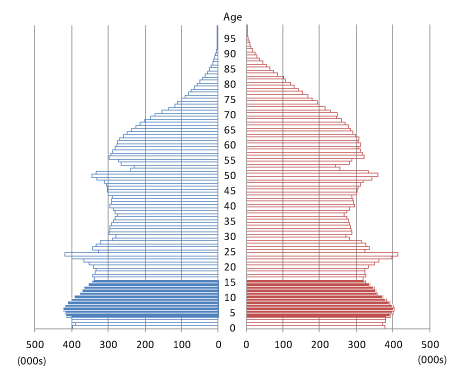
From around age 70, it is possible to see a large imbalance in numbers of men and women (1). Although an imbalance occurs normally in most populations at older ages, this is particularly pronounced due to increased mortality among young men during World War 1.
There is also an indentation between the ages of 52-55 (2). This indentation is due to a reduction in the number of births during the years 1915 -1918 due to World War 1, as well as the effect of increased infant mortality in due to the 1918-1921 influenza epidemic.
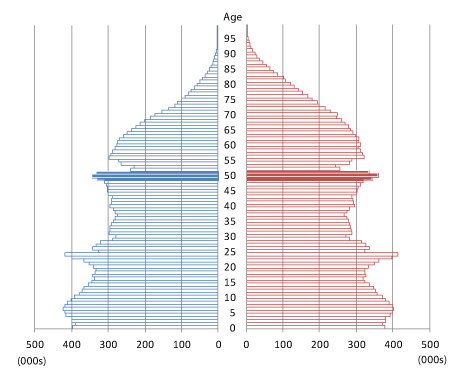
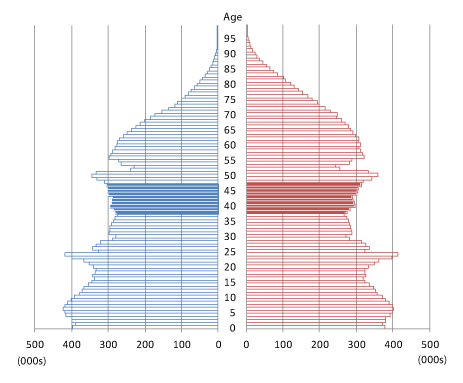
Although there was a small baby boom after World War 1 (3), numbers of births reduced once again in the 1920s and 1930s. This resulted in reduced birth cohorts, which in 1971 were aged between 38-47 (4). This was due to reduced numbers of young men, leaving many women unwed and therefore childless, and the fertility depressing effect of the economic recession during the 1930s.
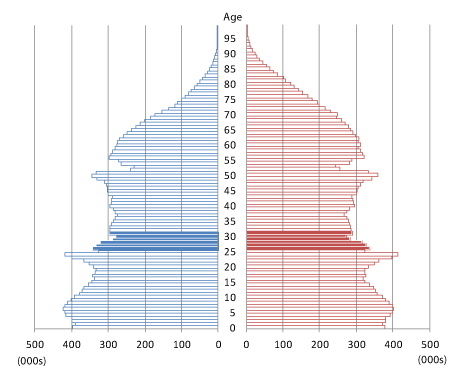
The effect of World War 2 on the number of births can be seen by the small cohorts aged 26-31 (5), which was followed by a baby boom at the end of war (6).
Finally, the baby boom of the 1950s and 1960s can clearly be seen in the bulge in the pyramid at ages 4-15 (7).