The age structural transition (cont.)
This pattern can clearly be seen in the changing shape of Japan’s population pyramid over time.
![]() Click on the tabs to see how Japan’s age structure changes through time.
Click on the tabs to see how Japan’s age structure changes through time.
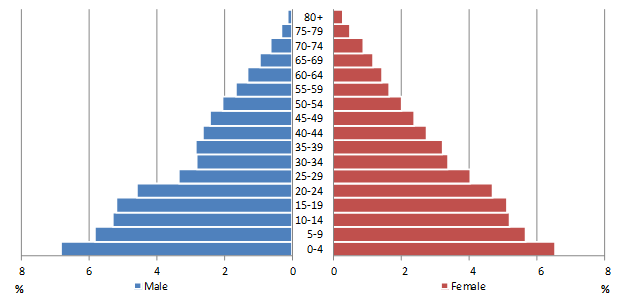
Japan 1950 – Median age 22.3
In 1950, Japan still had a young population age structure, and moderate fertility rates (TFR 3.00). This can be seen in the broad base of the pyramid.
N.B. Note the indentation of the male side of the pyramid at ages 25-34. This was caused by losses during World War 2.
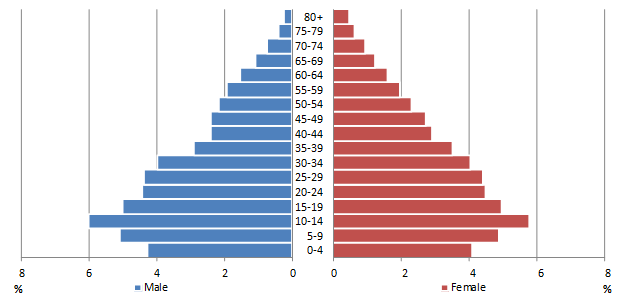
Japan 1960 – Median age 25.5
By 1960 the population pyramid clearly shows the decline in fertility (TFR 1.99) by the indentation at the 0-4 and 5-9 age groups. As these age groups are smaller, the proportion of the population at the youngest ages will also have reduced.

Japan 1970 – Median age 28.9
By 1970 the large cohorts from before the fertility decline are of working age. This means that people of working age will be a larger proportion of the total population than those at younger or older ages.
It is also possible to see an increase in the size of the youngest age groups. This is related to the larger cohorts moving into reproductive ages rather than an increase in fertility.
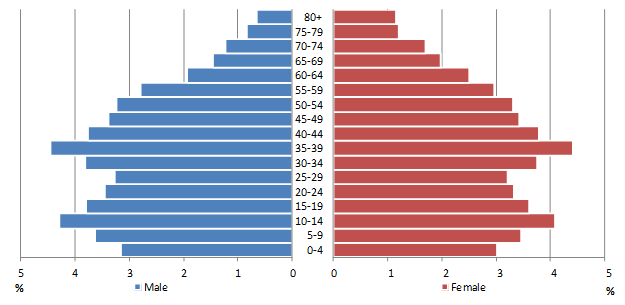
Japan 1990 – Median age 37.4
Although the largest cohorts are still of working age, they are now older and so will be impacting less on birth rates. They are also getting close to retirement which will have consequences for Japan.
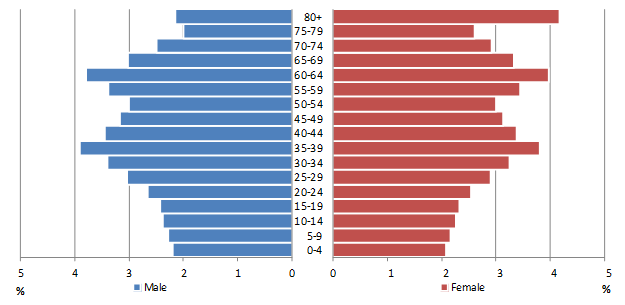
Japan 2010 – Median age 44.7
By 2010 the main bulges in the population pyramid are now clearly moving towards older ages.
TFR is below replacement at 1.32. This can be seen in the continuously declining cohort sizes at the youngest age groups.
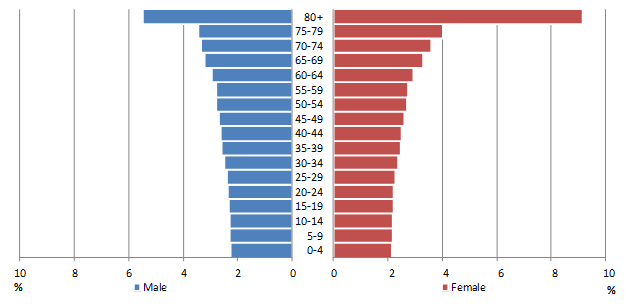
Projection: Japan 2050, medium variant – Median age 52.3
By 2050, if fertility begins to return to replacement level, Japan’s age structure will be similar to this. Each successive cohort is still declining in size, and the proportion of the population at the oldest age groups is high.
Of course there is no guarantee that Japan’s TFR will return to replacement levels, and the population ageing may be even more extreme than the scenario presented here.
Population pyramids for Japan, 1950-2050.
Source: UN Population Division 2011.