Age-specific Fertility Rates (cont.)
The series cry out to be plotted graphically:
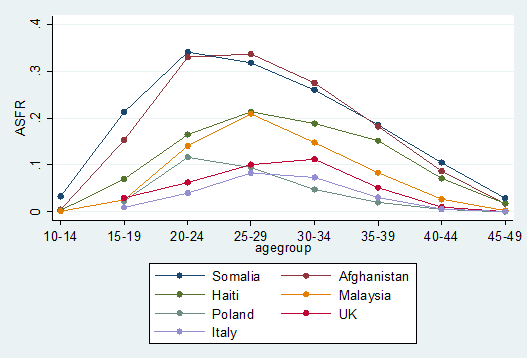
Figure 2: Patterns of age-specific fertility

We immediately see that there is a definite pattern – always single-modal (one summit only) and rather asymmetric. We have here the ability to display the pattern of fertility for any population. They are remarkably similar across populations although there are recognisable differences.
Somalia and Afghanistan show typical high fertility patterns with modes in the 20-29 ages and a typical slight right-skewness. Because the ASFRs are high throughout the age range these patterns suggest little fertility control.
At the other extreme there is the very low fertility pattern of Italy with little early childbearing and a shallow mode in ages 25-34. Poland and UK have only slightly higher fertility but they have quite different patterns of earlier and later childbearing respectively. Note that for some countries there is no point for the 10-14 age group. This does not mean that fertility at this age never occurs, just that it is so low as to be ignored. Note that it is low at ages 10-14 in all countries shown and makes little contribution to overall fertility.
Haiti and Malaysia show intermediate fertility but Malaysian fertility is more centrally concentrated. For Italy, UK and Poland to have such low fertility and for Malaysia to have such late childbearing with a pronounced mode suggests that conscious decision-making about childbearing is in operation. Some of this may be effected by social pressures concerning onset of sexual relations (quite possibly in Haiti) and age at marriage, but a large part of it is by adoption of contraception. Therefore these patterns suggest higher contraceptive prevalence than in Somalia or Afghanistan.