The Total Fertility Rate (cont.)
Period table with cohort example (cont.)
Here is the same table, with the same cohort highlighted. What if we decided to look at the cohort following them – starting in 1965-69?
 Think about who this would be and if there are any problems with this approach. Then press the button to reveal.
Table 2: Age-specific fertility rates, England and Wales, by calendar period.
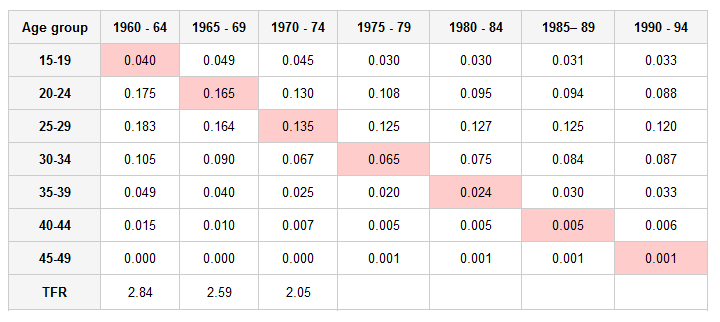

Now we have a small problem that is common with cohort analysis – we run out of data. But all is not lost - I have said before that demography is a very pragmatic discipline. We need a group aged 45-49 in 1995-99 to complete the series but it’s not available. Looking at the table you can see that the 45-49 group have consistently low fertility, almost zero. If we assume (with good reason) that this will continue then we can simply “borrow” the rate from the previous cohort. Borrowing a rate of 0.001 produces a Cohort Fertility Rate of 2.08.
We could probably do this once again for the next cohort – borrowing the last two rates. We may be slightly wrong but probably not much. However we can’t continue to do this because we start to get into age groups where fertility is high and we can’t just assume that it will be the same as it was 5 years earlier. So we still have a data limitation problem, which is common to cohort approaches.
The other issue is to what time period do these estimates belong – if we were to plot them on a graph with period rates where would we place the cohort TFRs? The answer is that we plot them in the year that represents the mean of the fertility distribution. This is typically around age 28 so we would plot the Cohort TFR of the 1960-64 cohort in the year in which they were 28. In this example this would be around 1973.
This process can be confusing and although Lexis diagrams seem complicated they can be a great help in clarifying the constitution of a cohort i.e. the link between age and period. On the next page there is a representation of this cohort in a Lexis diagram. You can see that this approach has actually NOT captured a pure cohort – but we have to work with the data available to us and not get too worried about niceties.