Standardisation (cont.)
In direct standardisation we take the observed age-specific mortality rates from each population and apply them to a specified standard population ![]() with a known age structure. This gives an age-adjusted number of deaths for each study population which can be used for comparisons.
with a known age structure. This gives an age-adjusted number of deaths for each study population which can be used for comparisons.
In other words, we compare the two populations by working out how many deaths there would be if each population kept its own observed age-specific mortality rates, but the structure of each population was the same.
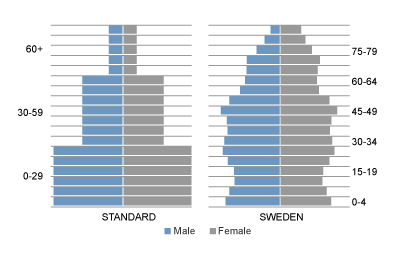
The age distribution of an (imaginary) standard population might be something like this:
| Age (years) | Population |
|---|---|
| 0-29 | 56,000 |
| 30-59 | 33,000 |
| 60+ | 11,000 |
| Total | 100,000 |
A standard population can be presented in 1,000s, 10,000s, 100,000s or millions. It does not matter because the numbers are only used to weight the estimates we obtain from the population of interest. In fact, some standard populations are presented as proportions that sum to one.
![]() Click the "graph" button below to see how the population distribution in Sweden compares with this standard population.
Click the "graph" button below to see how the population distribution in Sweden compares with this standard population.