Inconsistencies in the results from direct standardisation (cont.)
One commonly adopted approach to defining a standard population when making comparisons between two populations is to create a standard population whose age distribution falls exactly between the age distribution of each population under consideration. This is done by deriving the proportional age distributions of each population, and averaging the observed proportions at each age.
Thus, using the data from countries A and B on the previous page, the proportional age distributions (to three decimal places) are as in the third and fourth columns of the table below.
| Age group | Country A popula-tion (‘000) | Country B popula-tion (‘000) | A distri-bution | B distri-bution | Aver-age x 100 000 |
|---|---|---|---|---|---|
| 0-14 | 3622.380 | 8971.135 | 0.184 | 0.140 | 16200 |
| 15-44 | 8538.467 | 24700.42 | 0.432 | 0.384 | 40800 |
| 45-70 | 5579.032 | 21709.31 | 0.283 | 0.338 | 31050 |
| 70+ | 1993.112 | 8847.103 | 0.101 | 0.138 | 11950 |
The average population to be used as a standard is derived from the average of the distributions at each age, and multiplied up to give a suitably large population. The scaling of the population is not strictly necessary, but doing so avoids having very small values of expected events.
An alternative is to make use of a pre-defined standard population. To this end, a number of “ideal” standard populations have been proposed:
- the African standard
- the European standard
- the World standard
These make it easier to compare different populations.
These three standard populations are tabulated on the right. Click the buttons to see each of the population pyramids, or to restore the table.
| Africa | World | Europe | Table |
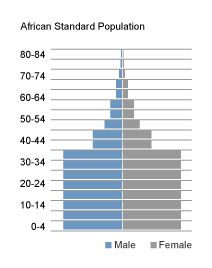
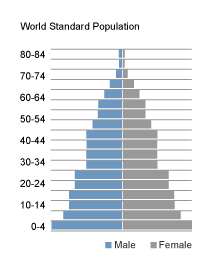
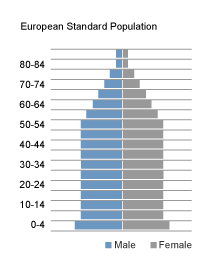
| Age | African | World | Europe |
|---|---|---|---|
| 0- | 2,000 | 2,400 | 1,600 |
| 1-4 | 8,000 | 9,600 | 6,400 |
| 5-9 | 10,000 | 10,000 | 7,000 |
| 10-14 | 10,000 | 9,000 | 7,000 |
| 15-19 | 10,000 | 9,000 | 7,000 |
| 20-24 | 10,000 | 8,000 | 7,000 |
| 25-29 | 10,000 | 8,000 | 7,000 |
| 30-34 | 10,000 | 6,000 | 7,000 |
| 35-39 | 10,000 | 6,000 | 7,000 |
| 40-44 | 5,000 | 6,000 | 7,000 |
| 45-49 | 5,000 | 6,000 | 7,000 |
| 50-54 | 3,000 | 5,000 | 7,000 |
| 55-59 | 2,000 | 4,000 | 6,000 |
| 60-64 | 2,000 | 4,000 | 6,000 |
| 65-69 | 1,000 | 3,000 | 4,000 |
| 70-74 | 1,000 | 2,000 | 3,000 |
| 75-79 | 500 | 1,000 | 2,000 |
| 80-84 | 300 | 500 | 1,000 |
| 85+ | 200 | 500 | 1,000 |
| Total | 100,000 | 100,000 | 100,000 |