How are life tables derived? (cont.)
The q and p columns and their relation to the lx column
We have already defined the q column as the risks of dying in an interval. So 5q10 is the risk of dying from exact age 10 to exact age 15. In the following table (first five rows of Table 1 as shown in previous page) this is 0.000935 (a very small risk). Below is how these columns are related to each other.
5p10 is simply the complement of 5q10 i.e. 1 - 0.000935 = 0.999065. Now that we understand what nqx and npx are we just need to know how they link with the lx column. Click each tab to show how the figures are derived in the life table.

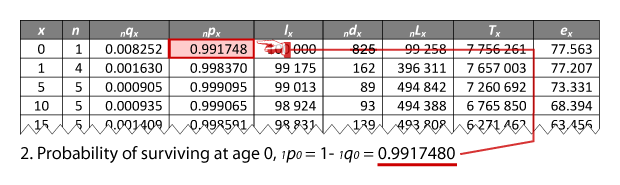
The risk of dying from birth to age 1 is 0.008252.

The probability of surviving is 0.991748.
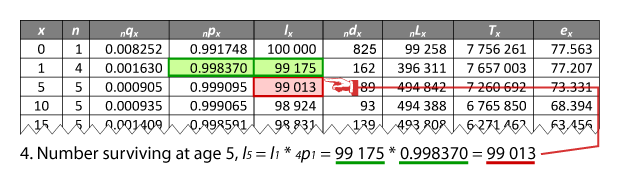
From 100,000 live births (the radix) the number surviving at exact age 1 (2nd line now) is 100,000 * 0.991748 = 99,175. This becomes l1!

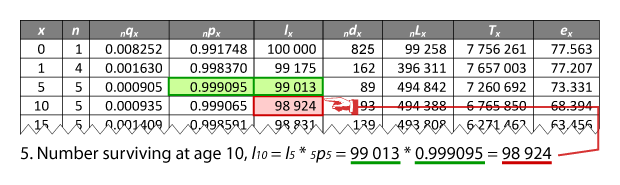
For those 99,175 their probability of surviving is 0.998370. 99,175 * 0.998370 = 99,013. This becomes l5 on the 3rd line.
And so on until the bottom of the table!
What we have done is take the probabilities of dying and, via probabilities of surviving, applied them cumulatively to the radix to get the survivors at each age.
We have effectively produced a hypothetical cohort, often described as a synthetic cohort. In this table it is not a real cohort because all the rates relate to 1985. It is a hypothetical cohort showing the survivors which would result in a real cohort if they experienced this set of age-specific probabilities of dying. It is therefore a period life table because it is a synthetic, not real, cohort and relates specifically to the period of 1985. It is possible to have a life table showing the mortality of a real cohort - this looks just the same and is called a cohort life table (or generation life table). It is historical because to construct it you need information on people going back 85+ years, so they are rather uncommon. The majority of life tables you will ever meet are period tables and this is assumed unless stated otherwise.
So we now understand the life table as shown in Table 1, up to the lx column. How do we get to the starting point - the nqx column - from a set of rates?