Introduction (cont.)
Graphical representation of some life table columns
Using the changeable graph below to see how some life table columns can be plotted.
The graphs have been plotted from a high mortality model life table, with an expectation of life at birth (e0) of 40 years. Infant and child mortality are therefore quite high.
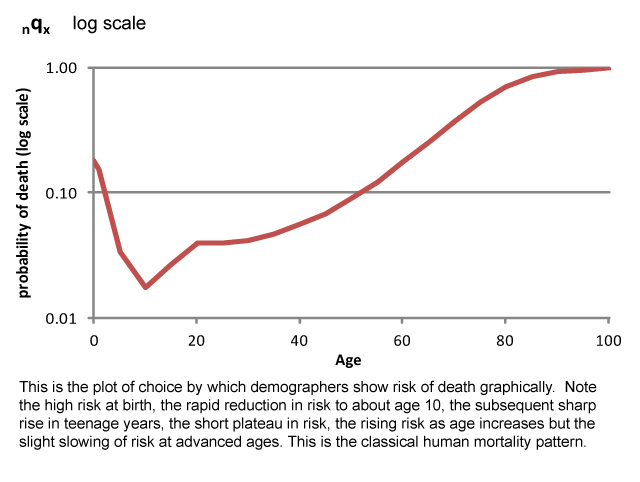
In particular, for nmx and nqx, note the difference between plotting on a linear or log scale. Although both are correct the log scale shows more detail at younger ages – and that detail is interesting and informative. Therefore it is conventional in demography to plot these two functions using a log scale on the y axis.