Healthy life expectancy (cont.)
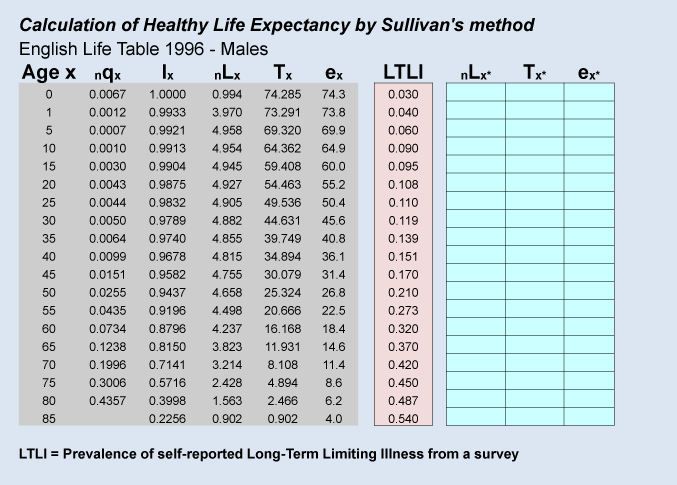
The spreadsheet below gives a demonstration of how Healthy Life Expectancy is estimated from a current life table, by Sullivan’s method. On the left is an abridged period life table for UK males in 1996. The centre column shows the prevalence of LLTI – Limiting Long-Term Illness. This was information from a national survey and is literally the proportion of interviewees who self-reported that they did suffer from a LLTI at the time of the survey.
Note how the proportion rises with age. This proportion is removed from the nLx column of the life table and the remainder is placed in the adjusted nLx* column on the right. Following this the adjusted life table is completed in the normal way, arriving at an adjusted expectation of life before LLTI, or death, occurs.
![]() Click on the arrows beneath the spreadsheet to see an explanation of the different steps.
Click on the arrows beneath the spreadsheet to see an explanation of the different steps.
![]() Download Healthy Life Expectancy Exercise Spreadsheet
Download Healthy Life Expectancy Exercise Spreadsheet ![]()
Note that the nLx column on the left can be thought of as either a column of actual population numbers (the stationary population) or a column of person-years lived. We are then removing either actual population numbers or person-years of LLTI sufferers – conceptually it works either way.
In the table above expectation of life at birth (e0) is 74.3 years. Using the Long Term Limiting Illness prevalences from a cross-sectional survey we have discounted (removed) the appropriate number of person-years spent with LTLI from the nLx column and recalculated life expectancy. This gives us an e0* figure of 60.4 years. The interpretation of this is that whereas the total expectation of life is 74.3 years under this mortality regime, one could expect 60.4 of those years to be lived without LTLI.
For a new-born baby this figure is of course highly speculative as much could happen in terms of illness prevention in the ensuing 60 years. For older persons it is still speculative, but less so. But for any age a series of such estimates, made over a number of years, could still be indicative of trends in healthy life expectancy, and therefore a useful public health indicator.