Examples of survey data and results
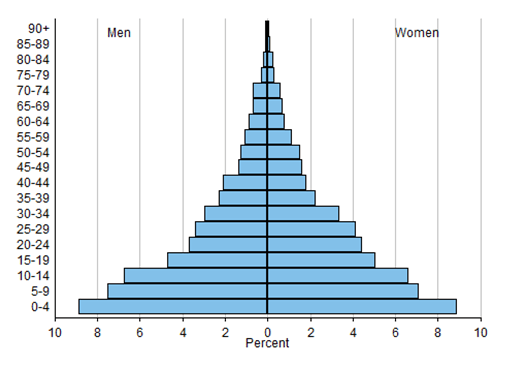
One of the most simple descriptive statistics in demography is the population pyramid. This can be drawn based on data from a sample survey. In this example we have used data from the 2005 Tanzanian Demographic and Health survey (www.measureDHS.com ![]() ).
).
DHS have at least three survey forms: a household questionnaire, a women’s questionnaire and a men’s questionnaire. Information on all household members is collected in the household questionnaire from a single respondent and all resident, adult women are eligible for a more detailed interview. A sub-sample of all resident, adult men is also interviewed.
The information needed to draw this graph can be gathered from the household questionnaire:
![]() Click here to open questionnaire (opens in new window)
Click here to open questionnaire (opens in new window)
| In order to draw the graph the data are summarised: |
To produce this graph: | ||||||||||||||||||||||||||||||||||||||||||||||||||||||||||||
|
 |