Examples of survey data and results (cont.)
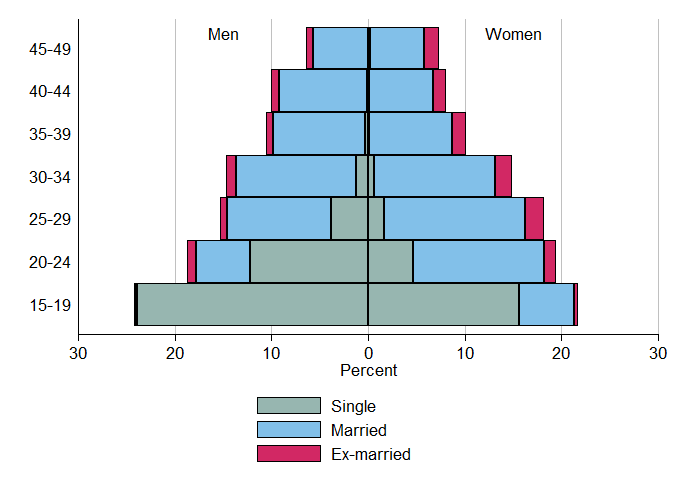
And the data are further summarised to produce the figures for the analysis, in this case a descriptive analysis of the distribution of marital status by age group shown in the table and the subdivided population pyramid.
Percentage distribution by men and women by age group and marital status
| MEN (%) | WOMEN (%) | |||||
| Age | Single | Married | Ex-married | Single | Married | Ex-married |
|---|---|---|---|---|---|---|
| 15-19 | 23.9 | 0.3 | 0.0 | 15.7 | 5.7 | 0.4 |
| 20-24 | 12.2 | 5.5 | 0.9 | 4.6 | 13.6 | 1.2 |
| 25-29 | 3.8 | 10.7 | 0.8 | 1.6 | 14.6 | 2.0 |
| 30-34 | 1.3 | 12.4 | 1.1 | 0.6 | 12.5 | 1.8 |
| 35-39 | 0.4 | 9.5 | 0.7 | 0.2 | 8.6 | 1.5 |
| 40-44 | 0.1 | 9.1 | 0.8 | 0.1 | 6.7 | 1.3 |
| 45-49 | 5.7 | 0.7 | 0.2 | 5.6 | 1.6 | |