Diagnostics (cont.)
Age structure of the population (cont.)
Regardless of the explanation, it should be self-evident that the pattern of age-heaping identified in these data are certainly not random, but are strongly indicative of systematic measurement error. Evidently, it would be unwise to analyse these data by single years of age. Grouping the population into conventional 5-year age groups (0-4, 5-9 etc) produces a smoother population distribution:
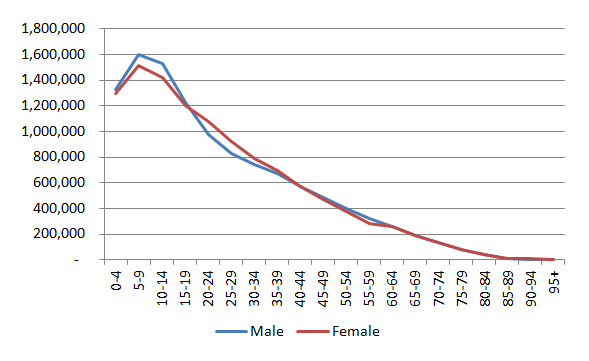
Another aspect of the data that might be worthy of consideration and further investigation is the apparent rapid decline in the number of children aged 0-4 in this population. Such a sharp decline is unlikely to be real, and is more likely to be symptomatic of widespread omission of young children, a common feature of developing country censuses.
With multiple-round survey data (such as that collected in longitudinal or panel studies), the internal consistency of the age-structure of the population would require that – if subsequent round of the surveys were conducted exactly 3 years apart - the age of each individual identified in two consecutive rounds of the study should increase by 3 years too.