Relational model life tables: an example (cont.)
Step 2
We now need to form the relationship between the standard and observed logits, and derive the alpha and beta parameters. This is usually done using linear regression, although it can be done graphically.
Use Excel, or some other spreadsheet, to perform a linear regression and derive the parameters. Hint: You are working with only four pairs of logits and the observed values should form the y values.
When ready press the reveal button to see a screen shot of how the spreadsheet should be laid out (Excel used for the example).

It is always useful, indeed essential, to look at the plotted values with the fitted line, to assess the fit of the observed values to the standard. To see the plot for this example press the reveal button.
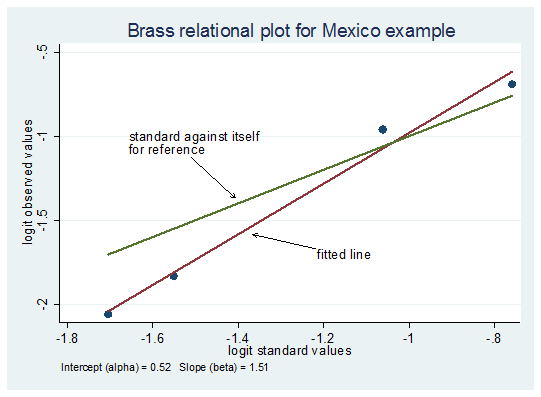
The fit is reasonable. One can see that child mortality is lower than the standard, and older age mortality higher – as expected from looking at the actual values themselves, and the value of beta.