Approaches to representing mortality (cont.)
Mathematical models (cont.)
Heligman and Pollard’s function
The mathematical function that best represents mortality over the entire age range is necessarily complex. Probably the best such function is that proposed by Heligman and Pollard in 1980. Their function is not based on the force of mortality (mx), but on the odds of mortality – the ratio of the probability of dying at any age to that of the probability of not dying at that age, i.e.
| qx | = | 1 - px |
| px | px |
Their function has 8 parameters, and is specified as follows:
|
= | A((x+B)C) | + | D.exp | ( | - | E.(ln(x) | - | ln(F))2 | ) | + | GH x |
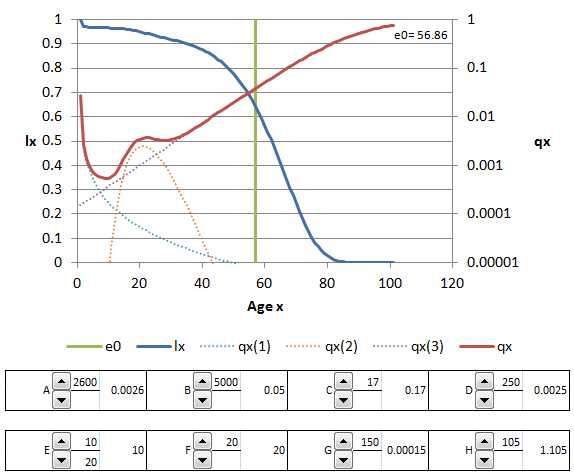
The first term (in A, B and C) seeks to capture the rapid decline in child mortality at younger ages. The last term (in G and H) has a clear analogue in the Gompertz mortality function. The middle term (in D, E and F) reflects a commonly-observed increase in mortality, especially due to accidents among males (the ‘accident hump’), or the effects of maternal mortality among women.
![]() Click on the icon below to download an interactive version of the graph.
Click on the icon below to download an interactive version of the graph.
![]() Heligman and Pollard: download interactive graph
Heligman and Pollard: download interactive graph ![]()
Note: a static version is shown above for reference purposes only.
![]() After experimenting with the above interactive graph, determine what each parameter contributes to the overall level of mortality in a population
After experimenting with the above interactive graph, determine what each parameter contributes to the overall level of mortality in a population
- A maps onto: affects the overall level of child mortality
- B maps onto: affects the level of infant mortality
- C maps onto: the rate of mortality decline in childhood
- D maps onto: the magnitude of the ‘accident hump’
- E maps onto: the spread of the ‘accident hump’
- F maps onto: the modal age of the ‘accident hump’
- G maps onto: the underlying level of older age mortality
- H maps onto: the rate of increase in older age mortality by age