Approaches to representing mortality (cont.)
Mathematical models (cont.)
Fitting mathematical expressions (cont.)
Fitting a Heligman-Pollard mortality function
There has been renewed interest in the Heligman-Pollard form since its incorporation of an accident hump might make it a suitable candidate to parameterise mortality associated with HIV/AIDS. Fitting a Heligman-Pollard curve to empirical data is mathematically difficult because of the number of parameters to be optimised simultaneously, but can be done with a degree of ease using the Solver function in Excel to minimise a chosen objective function. In many applications, the objective function is the sum of the squares of the differences between the observed and fitted data. Thus, if we define the objective function to be O,
| O | = |
|
( | n |
q | o x |
- | n |
q | f x |
) 2 |
Where the superscript ‘o’ refers to the observed morality probabilities and ‘f’ to the probabilities determined by fitting a Heligman-Pollard curve to the observed data. However, this objective function gives undue weight to the quality of the fit for those points where the observed values are largest. Accordingly, when fitting mortality curves using an optimisation technique we prefer to minimise the sum of the absolute percentage error between the observed and the fitted data,
| O | = |
|
| |
|
| |
![]() Mouse over the formula above to see further details.
Mouse over the formula above to see further details.
The specifics of using the Excel Solver routine to optimise the solution to non-linear equations is outside the scope of this course. In very broad terms, beginning with the observed mortality probabilities, one would set up a scalar of fitted probabilities based on parameters A through H. The absolute percentage error is then calculated for each probability and summed, giving rise to the objective function defined above. In Solver, one then sets out to minimise O by changing the values of the parameters A through H.>
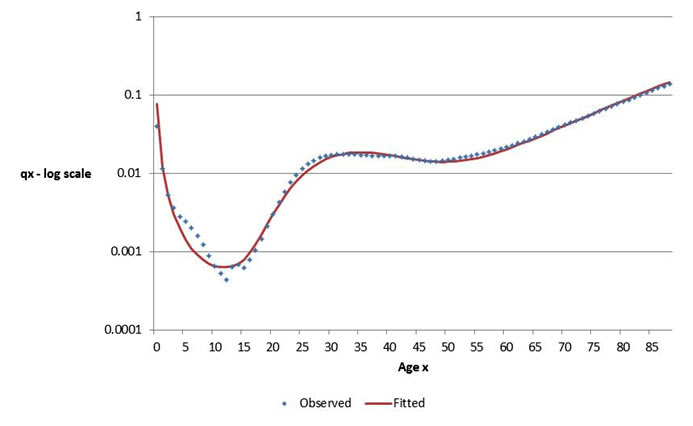
An example of a fit using Solver is shown below – the initial data are the results from a model examining the impact of HIV/AIDS on South Africa in 2005. Given the complexity of the underlying data, the fit is reasonably good – except at the youngest ages.