Hybrid models of fertility
The Coale-Trussell model
Coale and Trussell (1974) published a model which is still fairly widely used today - it is a hybrid between an empirical and a parametric model. The basic form of the model is:
where:
n(a) is an empirically-derived age-specific model of natural fertility, based on data presented in Henry (1961). ‘Natural fertility’ is the term Henry used to describe the fertility pattern that would occur in a population that made no conscious effort to limit births. Henry’s data are based on schedules of marital fertility among 13 (largely historical) populations assumed to embody natural fertility.
While there was some variation in the overall level of fertility (ranging from nearly 11 children per woman among the Hutterite sect in North America in the 1920s to just over six children per woman among villagers in studies conducted in Guinea and India in the mid-20th century), the patterns of fertility are very similar as is shown by the grey lines in the figure.
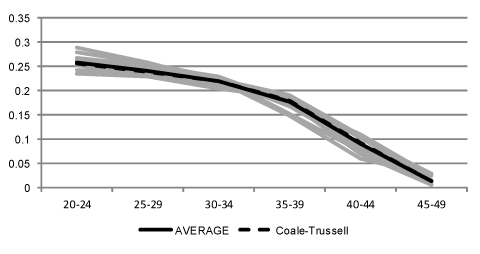
The black lines show the average of the 13 schedules and the distribution of fertility assumed by the Coale-Trussell model, which are almost identical.
The schedule of n(a) used in the Coale-Trussell model is:
| a | 20-24 | 25-29 | 30-34 | 35-39 | 40-44 | 45-49 |
| n(a) | 0.460 | 0.431 | 0.395 | 0.322 | 0.167 | 0.024 |
M is again a parameter that sets the level of fertility. In most representations of the model, this parameter is represented by M. Since the Coale-Trusell natural fertility schedule, n(a), is based on a fertility level of 9 children per woman between the ages of 20 and 49, M scales the schedule relative to this level of fertility.
v(a) is an empirically derived set of deviations from natural fertility as a result of parity-dependent fertility control. 43 schedules of marital fertility as observed in the 1960s were used to derive values of v(a). The sequence of v(a) is 0 up to the age 24, reflecting that no parity-dependent fertility control is likely up to that age, and thereafter decreases with increasing age, reflecting increased departure with age of controlled fertility relative to natural fertility.
| a | 20-24 | 25-29 | 30-34 | 35-39 | 40-44 | 45-49 |
| n(a) | 0 | -0.279 | -0.667 | -1.042 | -1.414 | -1.671 |
G(a,a0,k) is a functional representation of the cumulative proportion of the population married at age a, which depends on additional parameters a0 and k. The function G(a) was derived by Coale and McNeil (1972) as a description of the cumulative proportion of women who are married in a given population. The functional form of G(a) is complex (being the integral of a double-exponential function) and cannot be evaluated numerically. G(a) is itself dependent on values of a0 and k, so that f(a) in turn is also dependent on these values. The a0 and k are parameters that control the build-up of exposure to sexual intercourse in the population: a0 determines the starting age for exposure (in their tables Coale and Trussell allow it to vary between 12 and 18), and k determines how fast this exposure builds up once it has started (tables show it varying between 0.2 – fast build up – and 1.8 – slow build up). In their tables, the numerical integration has been performed using intervals of 0.01 of a year, and then cumulated to give values of G(a) for all ages between a0 and 49.
While the functional form of G(a) is complex, it can be imbued with some practical meaning. The double-exponential form inside the integral approximates the combined effect of a normal distribution with three exponential distributions. The normal distribution can be regarded as representing the age distribution of women becoming marriageable; while the three exponentials can be regarded as representing waiting-time distributions from becoming marriageable to finding a marriage partner; the second from finding a partner to becoming engaged; the third from engagement to marriage.
m determines how fast fertility falls off after the peak age - a zero value of m implies a population with natural fertility (since the effects of v(a) are thereby negated). A value of m of 1 would imply that the departure of marital fertility with age is the same as that as derived from the 43 schedules used to derive v(a). The maximum tabulated value for this parameter is 4.0, producing a fertility rate in the 45-49 age group which is about one thousandth of the modal fertility rate, compared with 8 per cent of the modal rate which is achieved when m is set to zero).
In the past, one of the major uses of the Coale-Trussell model was to calculate m as an indicator of the onset of marital fertility decline. More recently, a number of critiques of the use of m as such an indicator have been raised, and its use for these purposes has fallen off dramatically.
Nevertheless, where the availability of data is very limited, calculation of m can still offer some broad insight into the nature and extent of fertility decline.
G(a,a0,k) is a functional representation of the cumulative proportion of the population married at age a, which depends on additional parameters a0 and k. The function G(a) was derived by Coale and McNeil (1972) as a description of the cumulative proportion of women who are married in a given population. The functional form of G(a) is complex (being the integral of a double-exponential function) and cannot be evaluated numerically. G(a) is itself dependent on values of a0 and k, so that f(a) in turn is also dependent on these values. The a0 and k are parameters that control the build-up of exposure to sexual intercourse in the population: a0 determines the starting age for exposure (in their tables Coale and Trussell allow it to vary between 12 and 18), and k determines how fast this exposure builds up once it has started (tables show it varying between 0.2 – fast build up – and 1.8 – slow build up). In their tables, the numerical integration has been performed using intervals of 0.01 of a year, and then cumulated to give values of G(a) for all ages between a0 and 49.
While the functional form of G(a) is complex, it can be imbued with some practical meaning. The double-exponential form inside the integral approximates the combined effect of a normal distribution with three exponential distributions. The normal distribution can be regarded as representing the age distribution of women becoming marriageable; while the three exponentials can be regarded as representing waiting-time distributions from becoming marriageable to finding a marriage partner; the second from finding a partner to becoming engaged; the third from engagement to marriage.
n(a) is an empirically-derived age-specific model of natural fertility, based on data presented in Henry (1961). ‘Natural fertility’ is the term Henry used to describe the fertility pattern that would occur in a population that made no conscious effort to limit births. Henry’s data are based on schedules of marital fertility among 13 (largely historical) populations assumed to embody natural fertility.
While there was some variation in the overall level of fertility (ranging from nearly 11 children per woman among the Hutterite sect in North America in the 1920s to just over six children per woman among villagers in studies conducted in Guinea and India in the mid-20th century), the patterns of fertility are very similar as is shown by the grey lines in the figure.
The black lines show the average of the 13 schedules and the distribution of fertility assumed by the Coale-Trussell model, which are almost identical.
The schedule of n(a) used in the Coale-Trussell model is:
| a | 20-24 | 25-29 | 30-34 | 35-39 | 40-44 | 45-49 |
| n(a) | 0.460 | 0.431 | 0.395 | 0.322 | 0.167 | 0.024 |
M is again a parameter that sets the level of fertility. In most representations of the model, this parameter is represented by M. Since the Coale-Trusell natural fertility schedule, n(a), is based on a fertility level of 9 children per woman between the ages of 20 and 49, M scales the schedule relative to this level of fertility.
v(a) is an empirically derived set of deviations from natural fertility as a result of parity-dependent fertility control. 43 schedules of marital fertility as observed in the 1960s were used to derive values of v(a). The sequence of v(a) is 0 up to the age 24, reflecting that no parity-dependent fertility control is likely up to that age, and thereafter decreases with increasing age, reflecting increased departure with age of controlled fertility relative to natural fertility.
| a | 20-24 | 25-29 | 30-34 | 35-39 | 40-44 | 45-49 |
| n(a) | 0 | -0.279 | -0.667 | -1.042 | -1.414 | -1.671 |