United Kingdom and United Nations
population projections (cont.)
Fertility forecasts – United Nations
The United Nations Population Division (UNPD) has used a probabilistic method to forecast total fertility since the 2010-based release of World Population Prospects (Alkema et al. 2011).
The trends in total fertility during the fertility transition and in post-transitional populations are modelled separately. The transitional phase is defined as starting either when total fertility first dropped below its maximum value in that country or before 1950 if total fertility was <5.5 at that time. The post-transitional phase is defined as commencing at the mid-point of two successive five-year periods in which fertility rises having previously fallen to <2.
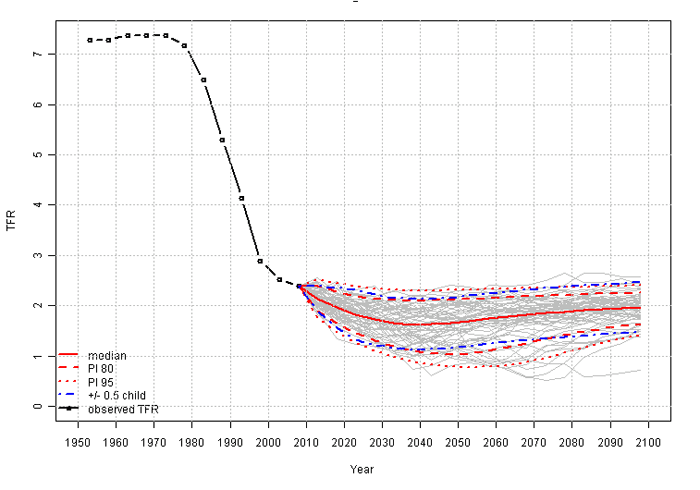
Probabilistic trajectories of projected total fertility (2010-2100) for Algeria
NOTE: For clarity, only 80 trajectories from 100,000 are displayed. The median projection is the solid bold red line, and the 80% and 95% projection intervals are displayed as dashed and dotted red lines respectively. The high-low fertility variants in the 2010 Revision correspond to +/- 0.5 child around the median trajectory displayed as blue dashed lines.
Source: United Nations, Department of Economic and Social Affairs, Population Division (2011). World Population Prospects: The 2010 Revision, Highlights and Advance Tables ![]() . ESA/P/WP.220
. ESA/P/WP.220
The transitional phase is modelled in a similar way to life expectancy by means of a double-logistic curve fitted using a Bayesian Hierarchical Model which yields country-specific distributions for the parameters of the decline. Historical trends within the country, the world's experience, and the variability in trends experienced in other countries at similar fertility levels in the past are used to inform the model.
The time series model used for the post-transitional phase assumes that, in the long term, total fertility will approach and fluctuate around the replacement-level of 2.1. For the 2012-based projections the model was fitted to data on 25 countries that have undergone an increase in fertility that was initiated from a sub-replacement level and that lasted for at least two successive five-year periods.
Uncertainty intervals for the projected total fertility rate are once again determined by calculating 100,000 forecasts for each country defined by random draws from the probability distribution for each parameter of the fitted model of total fertility. The median of these 100,000 trajectories is used for the medium fertility variant projection. At the world level, according to this forecast, total fertility will drop to 2.24 children per woman in 2045-2050, but 22 countries representing 14.5 per cent of the world’s population will still have total fertility of 3 or more children per woman at that time.
As well as its medium fertility projection, UNPD produces projections based on high and low forecasts of fertility. In the former variant, total fertility is assumed to be half a child per woman higher than in the medium forecast for most of the projection period. In the latter variant, it is assumed to be half a child lower. UNPD also produces projections based on two further fertility scenarios: that it remains constant in each country at the rates of the launch year and that it immediately shifts to its replacement level in each country at the start of the projection.
Forecast total fertility is distributed between five-year age groups by interpolating between the most recent age pattern of fertility available for the country and a model age-specific pattern which is assumed to represent the post-transitional pattern. Different model age-specific fertility distributions were used for high and medium fertility countries, today’s high-income countries, and ex-Soviet bloc countries.