Introduction (cont.)
Exercise (cont.)
Question 2
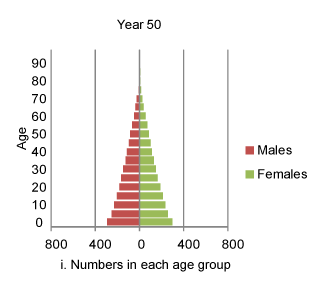
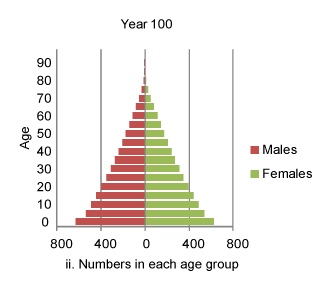
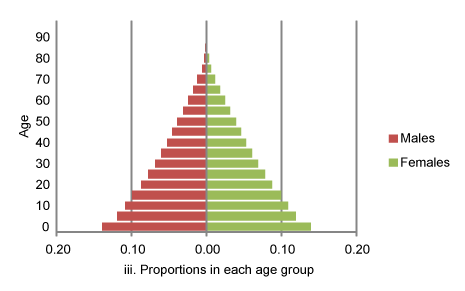
![]() As on the previous page, answer the question considering these pyramids.
As on the previous page, answer the question considering these pyramids.


| Graphs (i) and (ii) show the number of people in a stable population, graph (iii) shows the proportion. Do the proportions in each age group in graph (iii) represent the stable age distribution in: |