Introduction (cont.)

Exercise (cont.)

Question 3

Interaction Considering the illustrations below, label each of the statements as True of False.

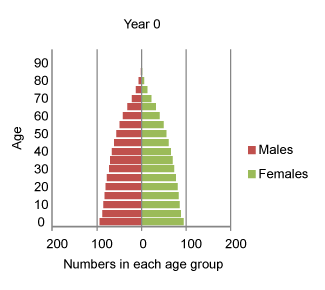
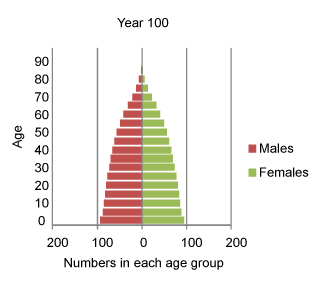
1. The number of people aged 60+ in year 100 is the same as the number aged 60+ in year 0.
a) True
b)
Check your answer
Please select an answer Correct, it's true. The graphs show numerically identical populations over time; they illustrate a stationary population which neither grows nor shrinks. Incorrect, it's true. The graphs show numerically identical populations over time; they illustrate a stationary population which neither grows nor shrinks.
2. The people aged 80+ in year 50 are the survivors of those aged 30+ in year 0
a)
b)
Check your answer
Please select an answer Correct, it's true. The stationary population is like a life table. Year 50 is 50 years on from year 0, so everyone is 50 years older. Incorrect, it's true. The stationary population is like a life table. Year 50 is 50 years on from year 0, so everyone is 50 years older.
3. The annual number of births in this population is larger than the annual number of deaths.
a)
b) False
Check your answer
Please select an answer Incorrect, it's false. Since the population is neither growing nor shrinking the annual numbers of births and deaths must be equal. Correct, it's false. Since the population is neither growing nor shrinking the annual numbers of births and deaths must be equal.