Introduction (cont.)
Exercise (cont.)
Question 4
![]() Considering the illustration below, answer the following questions.
Considering the illustration below, answer the following questions.
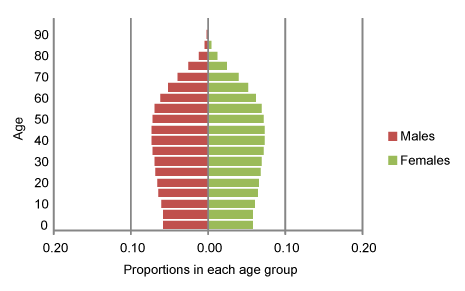
| 1. Which is the largest age group in this population? |
| 2. What kind of stable population is represented in this graph? |
Can you explain your answer?
|