Effects of mortality and fertility patterns on growth and age structure in stable populations (cont.)
Revision exercise 2
 Answer the questions about each parameter whose action is illustrated in the diagram. Note that the y axis measures survival rather than mortality.
 |
Negative values of alpha
| increase |
decrease |
concentrate |
|
|
|
mortality compared to the standard in which alpha is zero. |
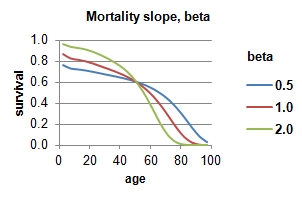 |
When beta is less than one, mortality slope is flatter than in the standard with beta equal to one, and
people survive to ages over 50 compared to the standard. |
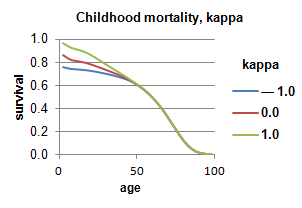 |
The model life table with the highest level of infant mortality has the childhood mortality parameter, kappa, equal to
|
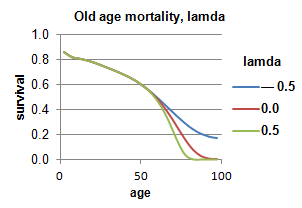 |
Positive values of the old age mortality parameter kappa have.
impact on child mortality. |