Self assessment questions
Question 1
Revision information
The Gross Reproduction Rate (GRR) is a measure of fertility level, corresponding to Total Fertility Rate in a "female only" population; it indicates how many daughters a woman who survived to age 50 would bear if she experienced current fertility rates.
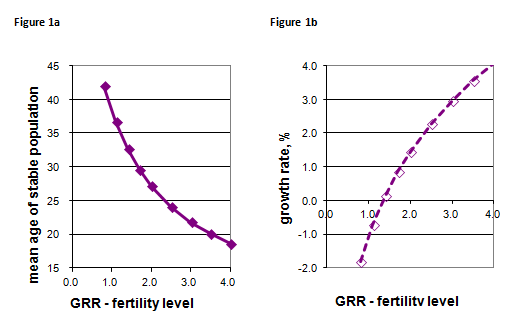
Figure 1a shows the relationship between GRR and the mean age of a stable population, Figure 1b shows the relationship between GRR and the growth rate of a stable population. In all the stable populations described by these curves the shape of the age-specific fertility schedule is the same, and the same life table is used to describe age-specific mortality.
![]() Choose from the alternatives to explain what these figures show:
Choose from the alternatives to explain what these figures show:
1. High levels of fertility produce a stable population with a age structure.
Correct, well done!
Figure 1a shows us that, at high levels of fertility, the mean age of the stable population is below 25, a young age structure.
2. A GRR of 2.0 corresponds to a TFR of and produces a stable population with a growth rate of percent.
Yes, correct!
In an earlier session you learned that GRR = TFR / 2.05 as it is a "female only" measure of fertility. Therefore TFR = GRR x 2.05 = 2.0 x 2.05 = 4.1
Correct!
Reading figure 1b, we can see that a GRR of 2.0 corresponds to a growth rate of 1.5%.
3. The shrinking stable populations all have GRR below and all have mean ages above years.
No, that’s not right. Figure 1b shows that the growth rate is below 0 for all GRR values of 1.3 and below.
Yes, well done!
Correct, excellent!
No, that’s not right. If we take the GRR value of 1.3 and look at figure 1a, we can see that shrinking stable populations have a mean age above 35.