Self-assessment questions (cont.)
Question 3
Revision information
The alpha parameter of the logit life table system determines the level of mortality. Positive values of alpha indicate that mortality is more severe at all ages than in the standard life table. Negative values of alpha indicate that mortality is less severe than in the standard life table. The standard life table with alpha = 0.0 has a life expectancy of 43 years, when alpha is -1.0 life expectancy is 71 years, for alpha = -2.0 life expectancy is 85 years, but if alpha was 0.5 life expectancy would be 27 years, if alpha rose to 1.0 life expectancy would be less than 14 years.

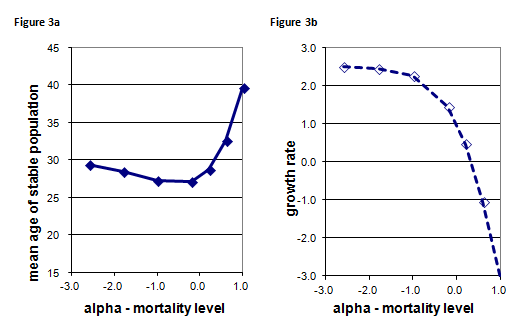
Figure 3a shows the relationship between alpha and the mean age of a stable population, Figure 3b shows the relationship between alpha and the growth rate of a stable population. In all the stable populations described in these figures the GRR that determines the fertility level is 2.0, and the beta parameter that determines the slope of mortality is 1.0.
![]() Choose from the alternatives to explain what these figures show:
Choose from the alternatives to explain what these figures show:
1. The stable populations in which alpha is negative have growth rates and life expectancy 40 years.
We can see from figure 3b that growth rates are positive (>0) when alpha is negative (<0). Even when alpha is exactly zero in the stable population with the given combination of GRR = 2 and mortality slope = 1 the growth rate is around 1%.
Correct.
In the revision information above you learned that an alpha value of 0.0 corresponds to a life expectancy of 43, so any life table with alpha < 0 will have a life expectancy higher than 43 years.
Correct.
2. A stable population with extremely low mortality has age structure than one with very low mortality because it has .
Figure 3a shows that the stable population mean age is older, about 29 years, when alpha is -2.0 (extremely low mortality with life expectancy = 85) compared with a mean age of about 27 when alpha is -1.0 (very low mortality with life expectancy = 71. The effect of longer life expectancy, which increases survival time and thus raises the mean age of the stable population, outweighs the impact of a marginally faster growth rate which might otherwise lower the mean age.
Correct.
Incorrect. The left hand end of the growth rate curve shown in figure 3b shows that when mortality is very low, most women already survive to the end of the reproductive period, so when it becomes even lower this has very little impact on the growth rate.
Correct.
3. A stable population with extremely high mortality has age structure than one with high mortality because it has .
Incorrect. The right hand end of the curve in figure 3a shows that the mean age of the population with extremely high mortality is almost 40, which is older than the mean age of the population with high mortality, about 33 years.
Correct.
Correct.
Incorrect. Shorter survival would lead to a population in which very few people reached older ages. A stable population with extremely high mortality would have an old age structure because it would have a negative (shrinking) growth rate, so that each successive birth cohort was smaller than the last.
4. When life expectancy varies between 50 and 70 years the mean age of the stable population differs by .
The part of the graph shown in figure 3a that corresponds to life expectancy values between 50 and 70 years lies between alpha <0.0 and alpha > -1.0 and the mean age curve is almost flat in this region, the mean age differs by less than 2 years. Figure 3b shows that between alpha = 0.0 and alpha = -1.0 the growth rate varies from 1% to 2%. Whereas lower mortality implies more people surviving to older ages, higher growth rates imply annually increasing births and thus relatively high proportions at young ages. In this range of commonly observed moderate mortality levels, the growth rate impact on age structure offsets the survival impact so that little difference is observed in the mean age of the stable population.
Correct.