Generalized stable population models
Age structure from past rates (cont.)
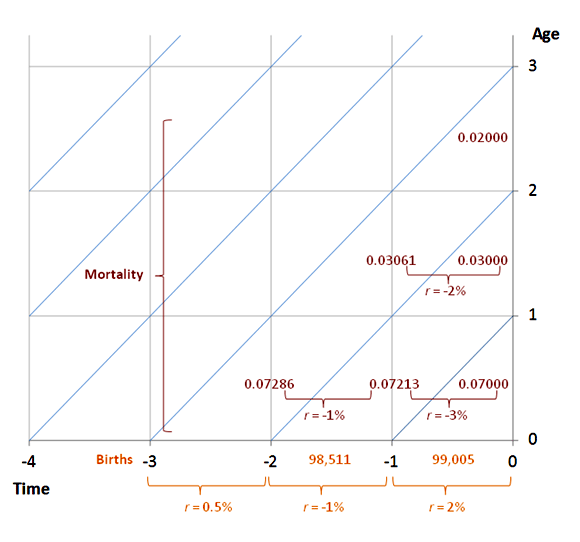
The lexis diagram also provides information on past age-specific death rates in this population. Using these rates, one can calculate survivorship in the period life table for the baseline date for the first few age groups. Remember that:
qx = mx / (1+0.5mx) and Lx = lx – 0.5dx
| Age (x) |
Age-specific death rates mx |
Probabilities of dying qx | Cumulative survivorship lx | Life table deaths dx |
Survivors in the age interval Lx |
|---|---|---|---|---|---|
| 0 | 0.07000 | 0.06763 | 100,000 | 6763 | 96,618 |
| 1 | 0.03000 | 0.02956 | 93,237 | 2756 | 91,859 |
| 2 | 0.02000 | 0.01980 |
90,481 | 1792 |
89,585 |
| 3 | 88,689 |
Exercise
![]() Calculate L2, the life table survivors between exact ages 2 and 3.
Calculate L2, the life table survivors between exact ages 2 and 3.
The correct answer is 89,585
Please attempt the answer.
Yes, that’s correct! The answer is 89,585
No, that's not right. Remember that: L2 = l2 – 0.5d2 = l2 (1 – 0.5q2)