Generalized stable population models
Age structure from past rates (cont.)

If mortality has been changing at every age and the number of births has been growing as well, then each of these changes has an additive effect on current growth at any age x. Assuming that growth is measured at the mid-point of each age interval:
This means that the information on the lexis diagram can also be used to calculate the growth rate in each age group at the baseline date (time 0).
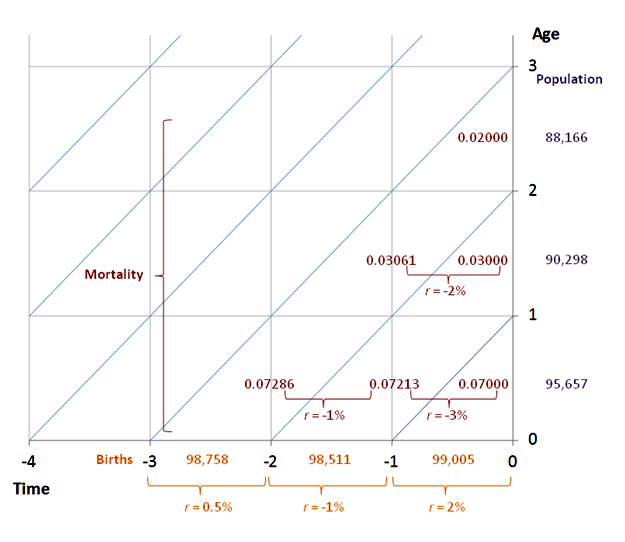
For the first age group, the growth rate at age 6 months depends only on the growth rate in the number of births as, if we carry out the calculations for one-year age intervals, the same death rate has applied to the infants over the entire period since their birth:
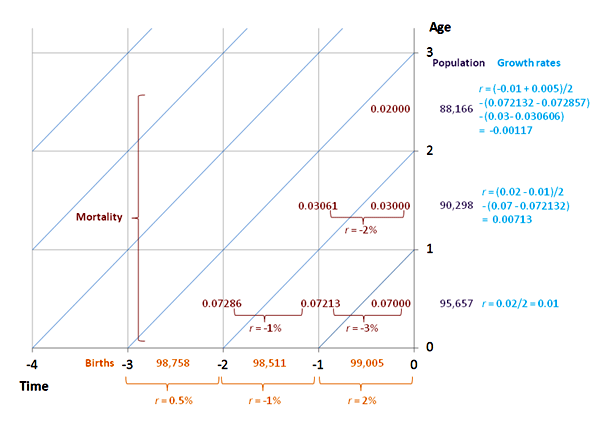
r0(0) = 0.5 rB(0) = 0.5 x 0.02 = 0.01
For the next age group, the growth rate at age 18 months depends both on how rapidly the number births grew between 6 and 18 months earlier and on the difference between the death rate in infancy of this cohort and the current infant death rate:
r1(0) = 0.5 ( rB(0) + rB(1) ) - ( m0(0) - m0(1) ) = 0.5 x (0.02 - 0.01) - (0.07 - 0.07213) = 0.00713
Exercise
![]() Calculate r2(0), the growth rate of the population aged 2 at the baseline date
Calculate r2(0), the growth rate of the population aged 2 at the baseline date
The correct answer is -0.00117
Please attempt the answer.
Yes, that’s correct! The answer is -0.00117
r2(0) = 0.5 ( rB(1) + rB(2) ) - ( m0(1) - m0(2) ) - ( m1(0) - m1(1) )
Remember that, because mortality is falling in this population, the growth of the death rate is negative, which adds to the growth rate of the population.