Generalized stable population models
Calculating age structure from growth
Generalized stable population relationships make it possible to relate age structure to mortality and births in cross-section. We do not have to know about the history of changing fertility and mortality in the population to determine its age structure from current births and survivorship in the life table. All we need to know is the net impact of these past changes in vital rates on current population growth.
In any closed population, whatever past trends in fertility and mortality:
assuming that the growth rates are measured at the middle of each age group. (As all the measures apply to the same date, the qualifier identifying the time to which the growth rates refer has been dropped). This equation enables us to calculate the age structure of a closed population from its current life table and age-specific growth rates. For example:
Note that these estimates of the numbers of infants and one-year old children are identical to those made by calculating the survivors of the births occurring in the past two years using cohort life tables. The age-specific growth rates contain all the information about the net impact of past changes in fertility and mortality on the population that is required in order to calculate its age structure.
Exercise
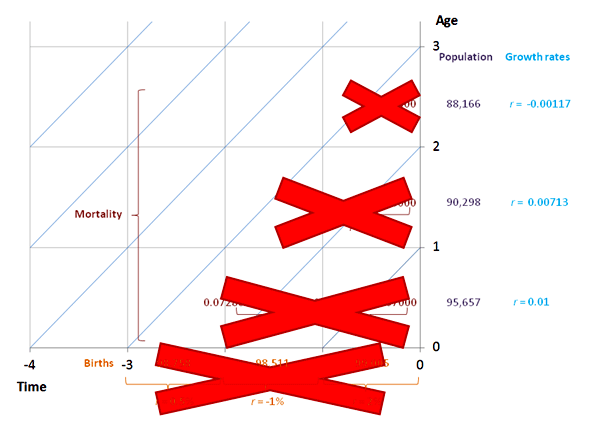
![]() Calculate P2, the population aged 2 from the current life table and age-specific growth rates.
Calculate P2, the population aged 2 from the current life table and age-specific growth rates.
The correct answer is 88,166
Please attempt the answer.
Yes, that’s correct! The answer is 88,166
If the rate of growth in the equation for age structure is the same at all ages (rx = r for all x), this equation becomes the expression for the age structure of a stable population. Generalized stable population models adjust the stationary population for x years growth with each age group growing at a different rate. Stable population models also adjust for x years growth but at a single fixed rate, so that r0+r1+r2 = 3r.