Conceptualising fertility decision-making and behaviours (cont.)
Fertility preferences by examination of reproductive behaviours (cont.)
Figure 3: Percentage of married women using a modern method by number of living children
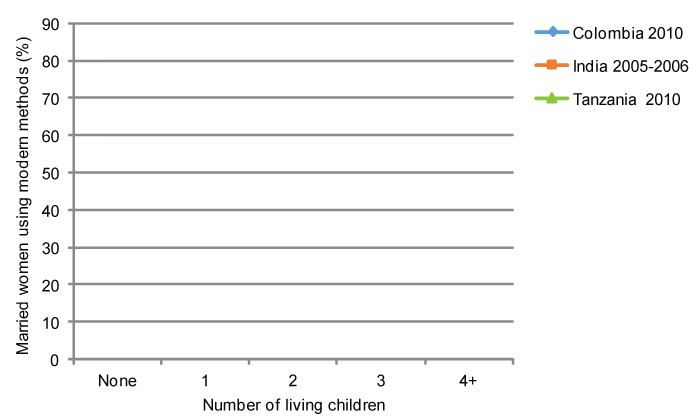
Source: DHS STATCompiler (http://www.statcompiler.com )
![]() What can you tell from this figure? Select missing words from the pull-down menus below.
What can you tell from this figure? Select missing words from the pull-down menus below.
1. Contraceptive prevalence is highest in all groups in Columbia. Over of women with 2 or more children are using a modern method, suggesting that a majority of women want to have 2 children (The TFR is 2.1 children).
2. There is clear family limitation at children in India. Over 60% of women with 2 or 3 children are using modern methods. The low prevalence of family planning among women with zero and 1 child may suggest that couples the first pregnancy and have a child immediately after the marriage, and do not space between the first and second birth (The TFR is 2.7 children).
3. In Tanzania, there is no clear difference in CPR by number of living children among women with 2 or more children. This trend and the high TFR (5.4 children) may suggest that the majority of couples do not have a specific targets for total number of children, and contraceptives are used for childbirths.