Fertility preferences and intentions (cont.)
Ideal and desired family size (cont.)
Figure 5: Mean ideal number of children among women and total fertility rate, 2000 or around, OECD countries
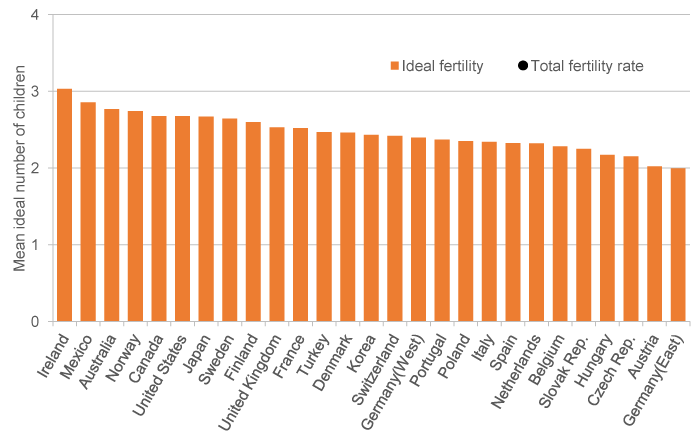
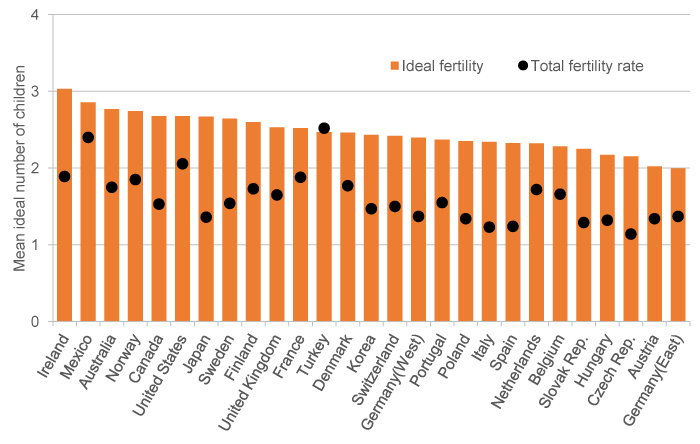
Source: The data is derived from World Value Survey, as in D’Addio A. and Mira d’Ercole M. 2005 and figures are from OECD (2014), OECD Family database, OECD Publishing, Paris
What can you tell from this figure?
![]() Select the missing words from the pull-down menus below.
Select the missing words from the pull-down menus below.
4. The ideal family sizes in all the OECD countries in Figure 3 except Ireland are between 2 and 3, suggesting the widespread 2-child norm in these countries. Except in Turkey, mean ideal family size exceeds total fertility rates. This may imply that many women may not realise their fertility desires during their life time..
5. While the ideal family sizes are similar, total fertility rates varies across the countries. The totally fertility rate in is 1.14, the lowest in the OECD countries, and it is highest in Turkey. The gap between ideal family size and total fertility rate is largest in (1.34).