Measuring unintended pregnancy (cont.)
Unwanted fertility using direct retrospective fertility intention
Figures 21: Planning status of births in the 5 years preceding the survey

| TFR | 4.4 | 3.8 | 2.4 |
| WTFR | 3.7 | 2.1 | 1.9 |
![]() What can you tell from the figure? Select the missing words from the pull-down menu below.
What can you tell from the figure? Select the missing words from the pull-down menu below.
1. The above figures show the 3 countries in Latin America and the Caribbean with different level of TFRs. Bolivia had the highest proportion of unintended pregnancies: % of births were retrospectively classified as unwanted and as mistimed. Guatemala had smaller proportion of unintended pregnancy which was almost equally divided by wanted and unwanted births. In Dominican Republic, 44% were unintended, of which were mistimed.
2. Guatemala had the highest TFR but the lowest unintended pregnancy among the three countries. This apparent counter-intuitive is because exposure to risk of unintended pregnancy increases as desired family sizes and fertility itself fall.
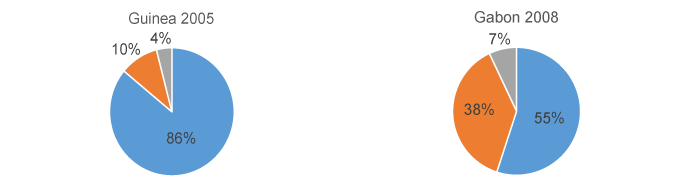
| TFR | 5.7 | 4.2 |
| WTFR | 5.1 | 3.5 |
3. An overwhelming majority of births were retrospectively classified as wanted in Guinea (86%). Only 14% were unintended. This low level of unintended births is due to the high fertility desire. Moreover, women in Guinea may be more reluctant to report a birth was unintended after the birth than the respondents in other countries. In Gabon, 45% of births were unintended, % of which were mistimed.
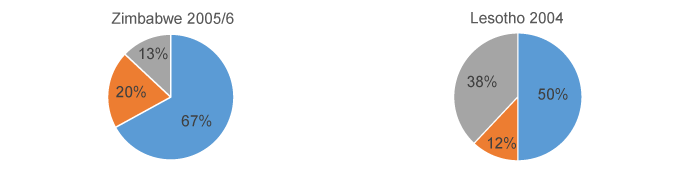
| TFR | 3.8 | 3.5 |
| WTFR | 3.3 | 2.5 |
Source: Westoff (2010)
4. In Zimbabwe 33% of births were unintended and the majority was reported as mistimed. In contrast, Lesotho not only had a higher percentage of unintended births in the past 5 years but also the majority was classified as .
5. In sub-Saharan Africa more women report recent births as mistimed than unwanted, as shown in Guinea, Gabon and Zimbabwe. But changes have been observed recently in several African countries, such as Lesotho and Rwanda: the proportion of births exceeds that of the .