Measuring unintended pregnancy (cont.)
Prevalence and incidence of unintended pregnancy
As mentioned earlier, estimation of unintended pregnancy is complicated due to the difficulty in obtaining good quality data on abortion. Thus the prevalence and incidence of unintended pregnancy is estimated by combining survey data on unintended births with indirect estimates of abortion incidence that are estimated for all sub-regions and for many countries.
Figure 23 and Table 1 present the estimated global and regional prevalence and incidence of unintended pregnancies. The estimates are derived from combining regional estimates on induced abortion and retrospective survey data on mistimed and unwanted births together with allowance for miscarriages. Unintended births are those occurring two or more years sooner than desired, or not wanted at all, and the data are derived from the retrospective direction questions on women’s preference of the recent births.
Figure 23: Incidence of unintended pregnancy per 1,000 women aged 15-44, worldwide 2008
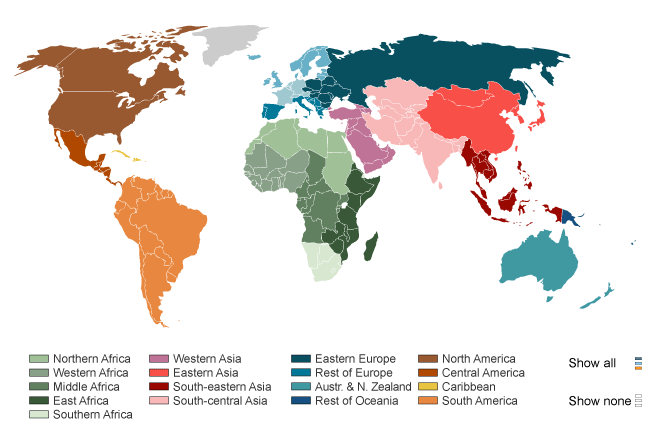
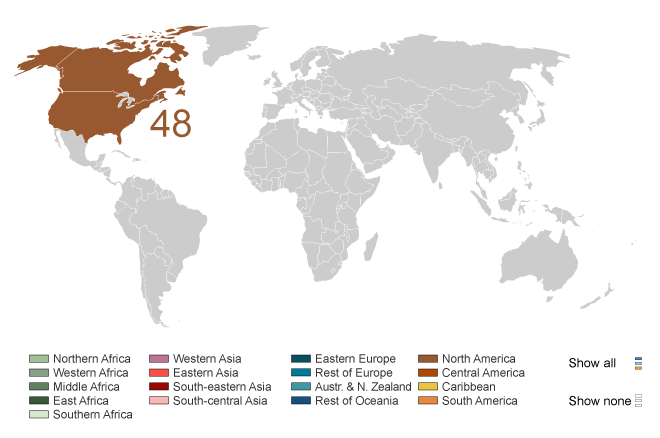
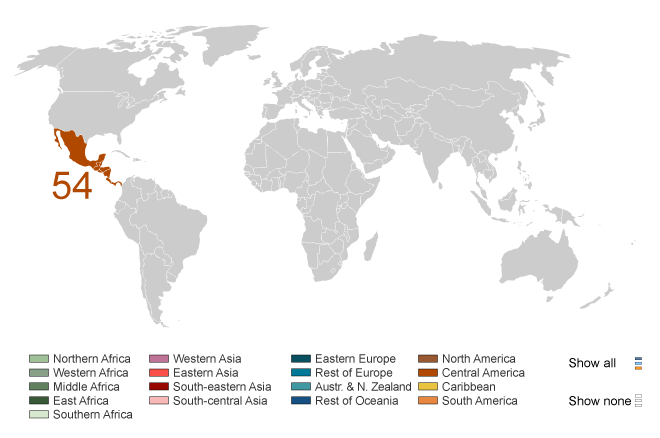
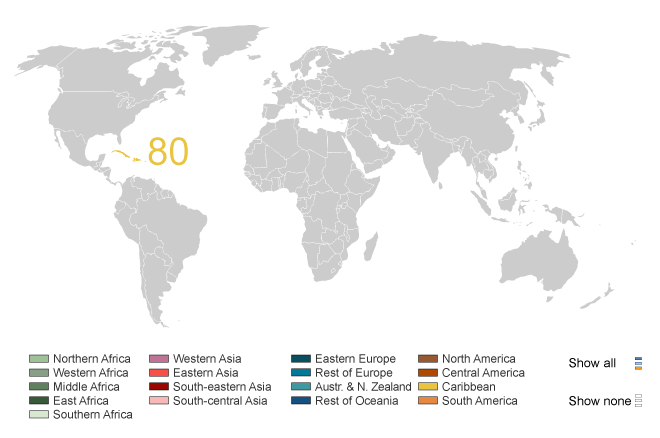
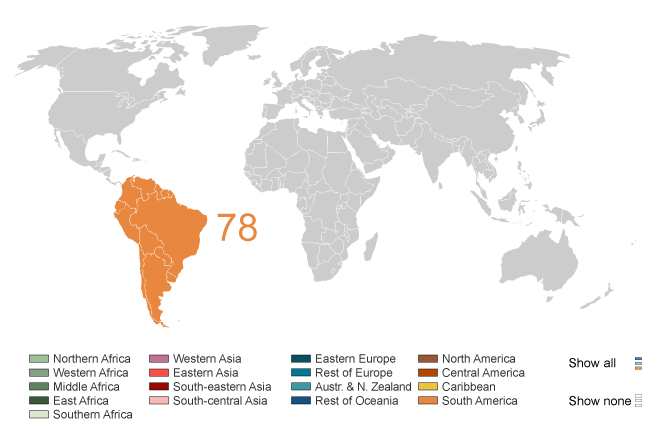
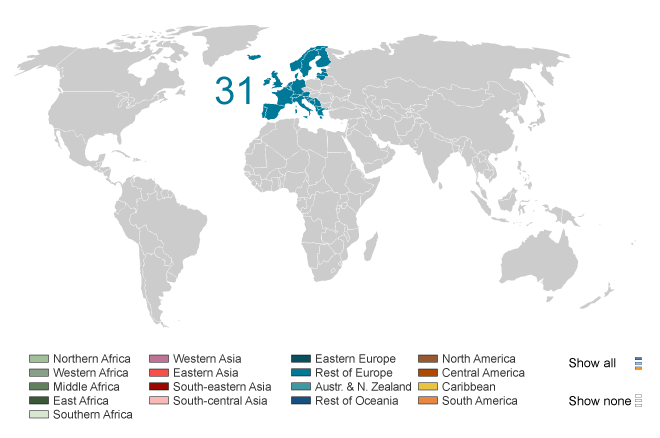
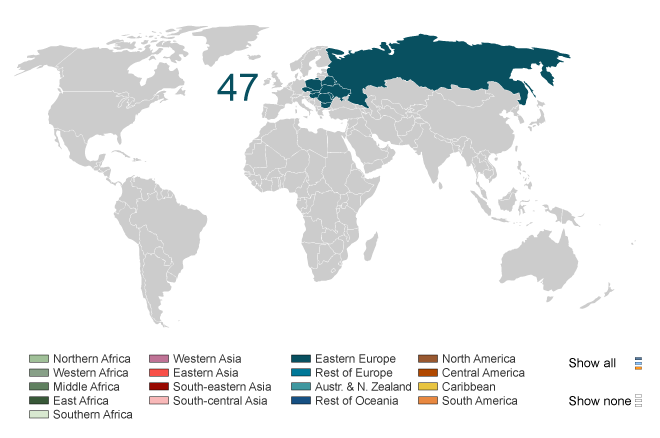
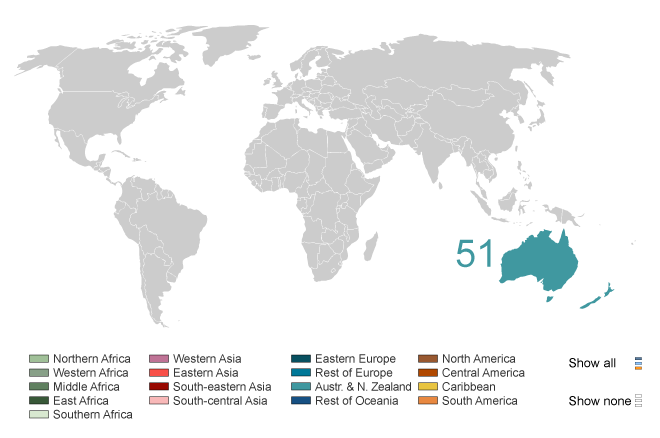
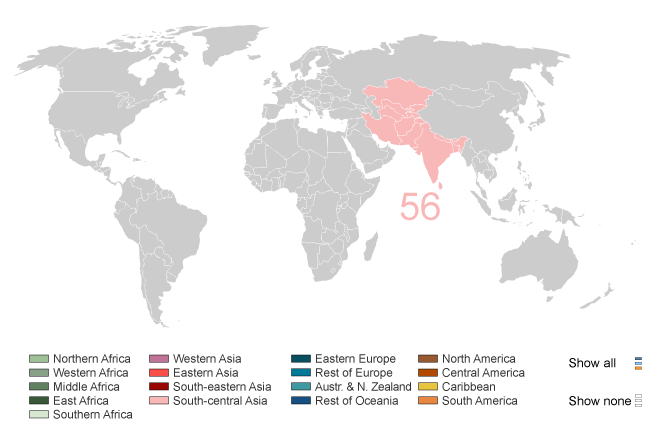
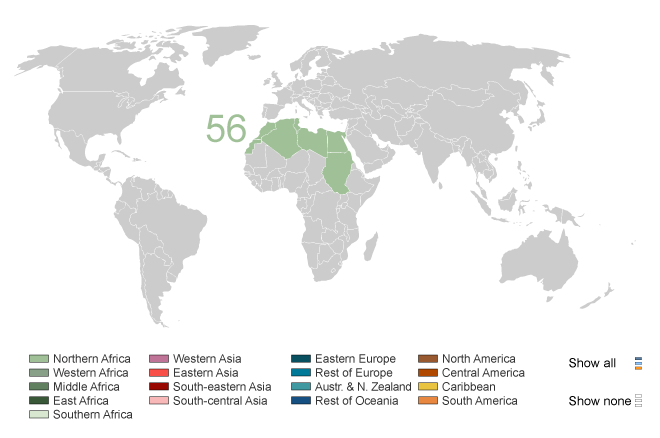
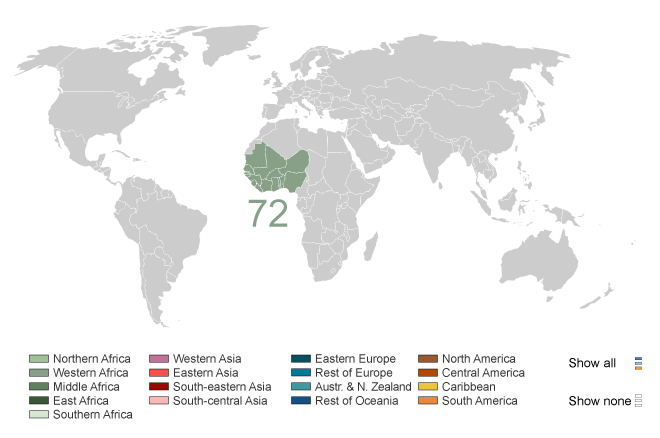
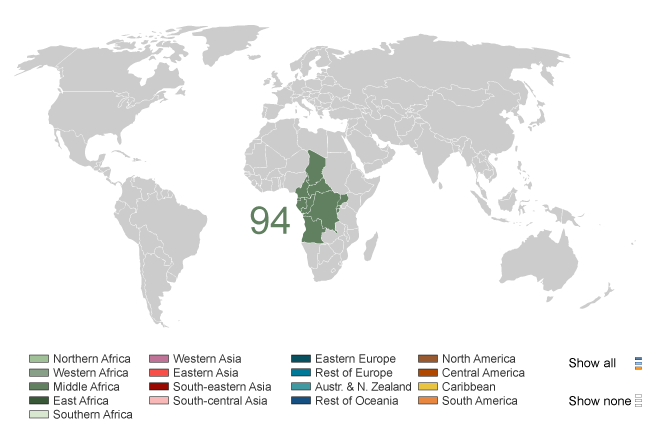
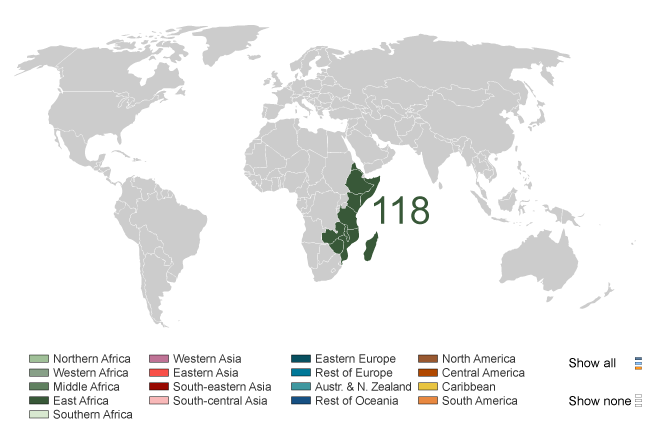
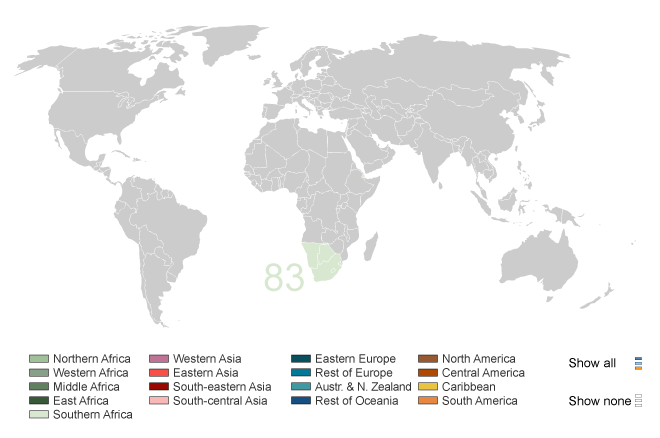
Source: Singh et al.(2009)
Table 1: Percentage distribution of all pregnancies and number of pregnancies in major world regions and subregions, 2008
| Region | % distribution of pregnancies | Total number of pregnancies (millions) |
|||
|---|---|---|---|---|---|
| Intended | Unintended | ||||
| Births | Abortions | Miscarriages | |||
| World | 59 | 16 | 20 | 5 | 206.2 |
| More developed regions | 53 | 15 | 25 | 6 | 22.8 |
| Less developed regions | 60 | 16 | 19 | 5 | 185.4 |
| Africa | 61 | 21 | 13 | 5 | 49.1 |
| Asia | 62 | 12 | 21 | 5 | 118.8 |
| Latin America and the Caribbean | 42 | 28 | 22 | 8 | 17.1 |
| Europe | 56 | 11 | 28 | 5 | 13.2 |
| Northern America | 53 | 23 | 18 | 7 | 7.2 |
| Oceania | 64 | 16 | 16 | 5 | 0.9 |
Source: Singh et al. (2009)
According to their estimates, the global prevalence of unintended pregnancies is 41%, among which 49% are terminated and 39% result in live births. Latin America and the Caribbean region has the highest percentage of unintended pregnancies. Incidence of unintended pregnancy is highest in sub-Saharan Africa due to the high pregnancy rate.