Access to family planning (cont.)
Demand for family planning satisfied (cont.)
Figure 26: Trend of contraceptive prevalence, unmet need and total demand for family planning (any method) and total fertility rate, 1970-2010, selected countries
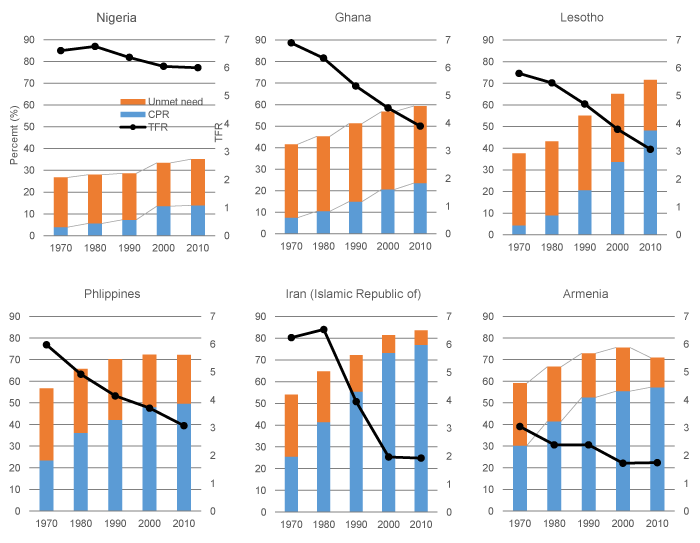
Source: United Nations 2012. World Population Prospects: The 2012 Revision. United Nations.2014. Model-based Estimates and Projections of Family Planning Indicators 2014
3. Figure 26 presents contraceptive prevalence, unmet need and total demand for family planning (CPR + unmet need) in the selected countries in Africa and Asia. There are % of women who want no more children or want to wait for at least 2 years in Nigeria in 2010, and the total demand and unmet need progress little in the four decades. But the CPR increased by 10%.
4. Unmet need made small changed in Ghana as well. But the CPR increased by %, and an increase in total demand is attributable to an increase in .
5. In contrast, Lesotho made a substantial progress in the same period. The total demand increased from 38% to 72%, and the CPR increased by %. The proportion of women with unmet need declined by 10%.
6. With regard to fertility, TFR declined by about children and Ghana and Lesotho, whereas it decreased only by child in Nigeria