Access to family planning (cont.)
Demand for family planning satisfied (cont.)
Figure 27: Trends of percentage of demand for family planning satisfied, 1970-2010, selected countries
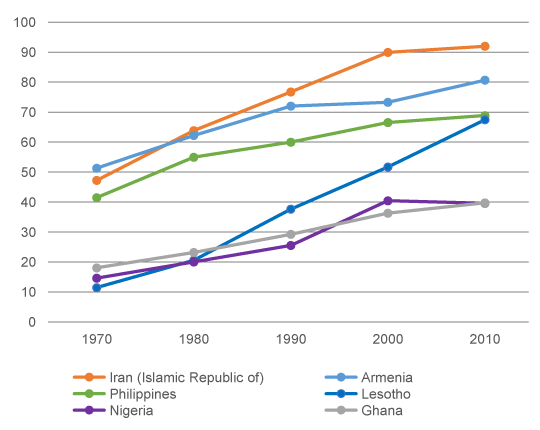
Source:United Nations 2014. Model-based Estimates and Projections of Family Planning Indicators 2014.
Figure 27 show % of demand for family planning satisfied (CPR divided by total demand for family planning). In 1970, Lesotho, Ghana and Nigeria had the same level of % of demand satisfied. It increased substantially from 11% to 68% in Lesotho in the four decades, but Ghana and Nigeria observed smaller increase.
7. From Figure 26 and 27, which country made more progress in population and family planning programmes, Ghana or Nigeria, between 1970 and 2010? Please explain your answer.
Although changes in % of demand for family planning satisfied are similar, from about 15% to 40%, in both countries, a set of the 4 indicators suggests that Ghana has made much more progress in access to family planning, changing fertility preferences and reducing in fertility. Unmet need changed little in both countries, but the total demand increased more in Ghana than in Nigeria, CPR increased more and TFR dropped much more substantially in Ghana than in Nigeria.
As fertility preferences and demand for family planning change during fertility transition, it is important to examine a set of indicators to monitor progress.
8. Among the three Asian countries, Iran experienced a dramatic drop in TFR from 6.24 to 1.93 supported by significant increase in CPR and total demand, and reduction in unmet need between 1970 and 2010. In contrast, Philippines shows a slower change and the unmet need is still high in 2010.
9. Contraceptive prevalence, unmet need, % of demand satisfied was very similar in 1970 in Armenia and Iran, but TFR was 6.53 and 2.39 respectively. As discussed earlier, this low fertility regardless of the low CPR in Armenia indicates prevalent practice of