Review of cohort PPRs (cont.)
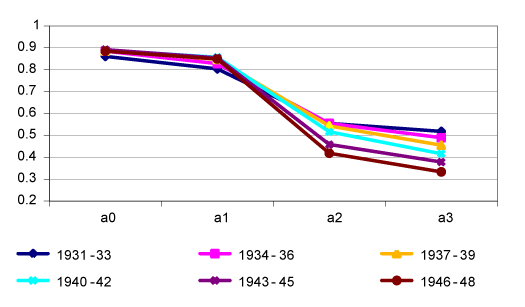
The following figure, taken from session PAPP101_S04  , presents cohort PPRs for six three-year age cohorts of British women born between 1931 and 1948. As they were calculated from data on women aged 45–49, a few of the women will have had another child before their menopause.
Quiz on the interpretation of PPRs
 Are the following statements about the PPRs shown in the figure true or false?
That's correct.
NO. The statement is true. a0 is the proportion of women in these cohorts who had a 1st birth and is about 0.9. Therefore, the proportion of the women who remained childless as a percentage is approximately 100 x (1-0.9) = 10 per cent.
NO. a1 is the proportion of women with a 1st birth who go on to have a 2nd child. However, only about 86 per cent of this cohort had a 1st birth. Therefore, the percentage of them who had 2+ children is about 100 x (0.86 x 0.8) ≈ 69 per cent.
Correct.
NO. a3 is a measure of progression from the 3rd to the 4th birth so the statistics refer to the proportion of women who progressed from 3 to 4 children, not 2 to 3 chidren.
Correct.
Correct, well done.
NO. The statement is true. The proportions of women who had any children and of those women who had a 2nd child rose slightly, but the proportion that then progressed to the 3rd birth fell. Therefore, more women had exactly 2 children.
If you had difficulty answering these questions correctly, you should review the material on PPRs in session PAPP101_S04 before proceeding with this session.