Parametric models of fertility (cont.)
Hadwiger’s model
The final class of parametric models discussed is that proposed by Hadwiger (1940) and refined by Gilje and Yntema (1970). This version of the Hadwiger model is represented by:
This is a four parameter model (with parameters R, H, T and d). Unfortunately, Hadwiger and his successors have used rather different notation compared to the other models; so here, for example, T does not relate to the level of fertility, which is accommodated by the scaling factor R.
![]() Like on the previous page, click on the link below to download a spreadsheet with an interactive graph. Experiment with it to identify what each parameter does to the shape and level of the curve.
Like on the previous page, click on the link below to download a spreadsheet with an interactive graph. Experiment with it to identify what each parameter does to the shape and level of the curve.
![]() Hadwiger’s model: download interactive graph
Hadwiger’s model: download interactive graph ![]()
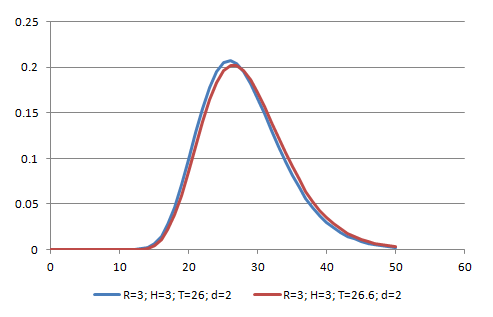
Note: a static version is shown above for reference purposes only.
R clearly relates to the total fertility rate, in other words, it affects the level; H affects how peaked the distribution is. T+d is associated with the mean age of childbearing; while d is an offset shifting the entire curve to the right. However, as Hoem, Madsen, Nielsen et al. (1981) note, neither H nor T have direct or intuitive demographic interpretations.